TWSLA (TWSNMP’s Simple Log Analyzer)





TWSLA is a lightning-fast, zero-config CLI log analyzer. Designed for sysadmins who need to grep, count, and visualize patterns from massive logs instantly without setting up complex ELK stacks.
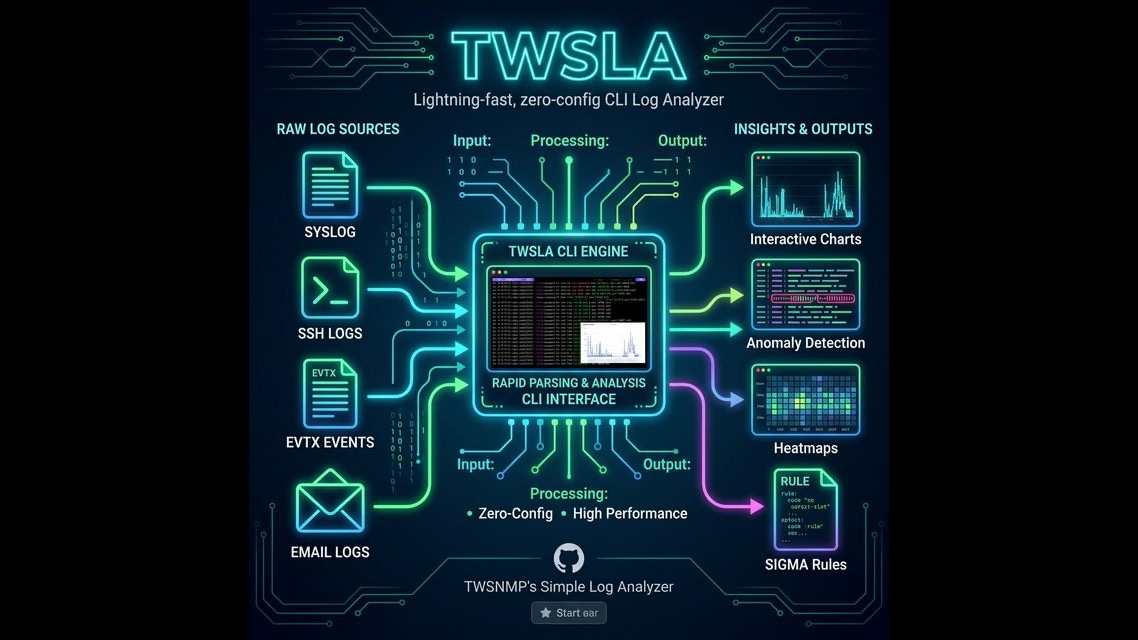
TWSLA is a simple log analysis tool of the TWSNMP series. Works on Linux/Mac OS/Windows.
Install
It is recommended to install on Linux/macOS using the shell script.
$ curl -sS https://raw.githubusercontent.com/twsnmp/twsla/main/install/install.sh | sh
On Linux/macOS, it can also be installed via Homebrew.
$ brew install twsnmp/tap/twsla
On Windows, download the zip file from the releases page or install via scoop.
> scoop bucket add twsnmp https://github.com/twsnmp/scoop-bucket
> scoop install twsla
Basic usage
- Create a work directory.
- cd to that directory.
- Import the log with the import command.
- search commands are searched.
- The results can be output such as CSV.
~$mkdir test
~$cd test
~$twsla import -s <Log file path>
~$twsla search
Command explanation
Illustration of command system
You can check the commands that support the Help command.
$twsla help
Simple Log Analyzer by TWSNMP

Usage:
  twsla [command]

Available Commands:
  ai          AI-powered log analysis
  anomaly     Anomaly log detection
  completion  Generate the autocompletion script for the specified shell
  count       Count log
  delay       Search for delays in the access log
  email       Search or count email logs
  extract     Extract data from log
  heatmap     Command to tally log counts by day of the week and time of day
  help        Help about any command
  import      Import log from source
  mcp         MCP server
  model       Manage local LLM models
  relation    Relation Analysis
  search      Search logs.
  sigma       Detect threats using SIGMA rules
  tfidf       Log analysis using TF-IDF
  time        Time analysis
  twlogeye    Import notify,logs and report from twlogeye (deprecated: use 'import twlogeye://...' instead)
  twsnmp      Get information and logs from TWSNMP FC
  update      Update twsla to the latest or specified version
  version     Show twsla version

Flags:
      --config string      config file (default is $HOME/.twsla.yaml)
  -d, --datastore string   Log DataStore path (.db, .badger, .parquet) (default "./twsla.db")
  -f, --filter string      Simple filter
  -h, --help               help for twsla
  -v, --not string         Invert regexp filter
  -r, --regex string       Regexp filter
      --sixel              show chart by sixel
  -t, --timeRange string   Time range

Use "twsla [command] --help" for more information about a command.
When the command is illustrated
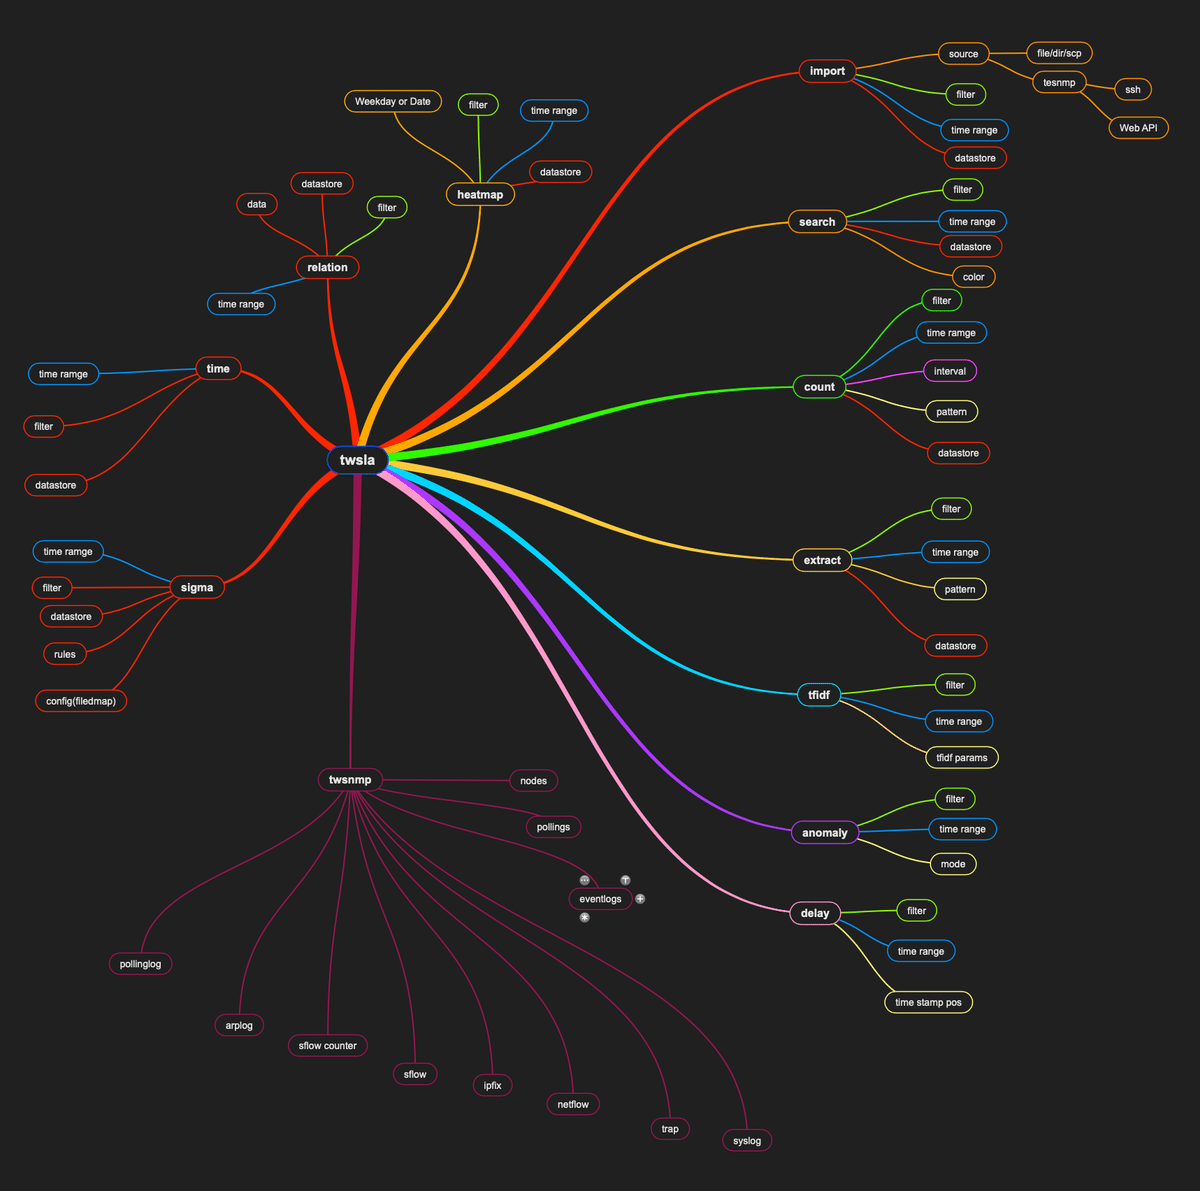
import command
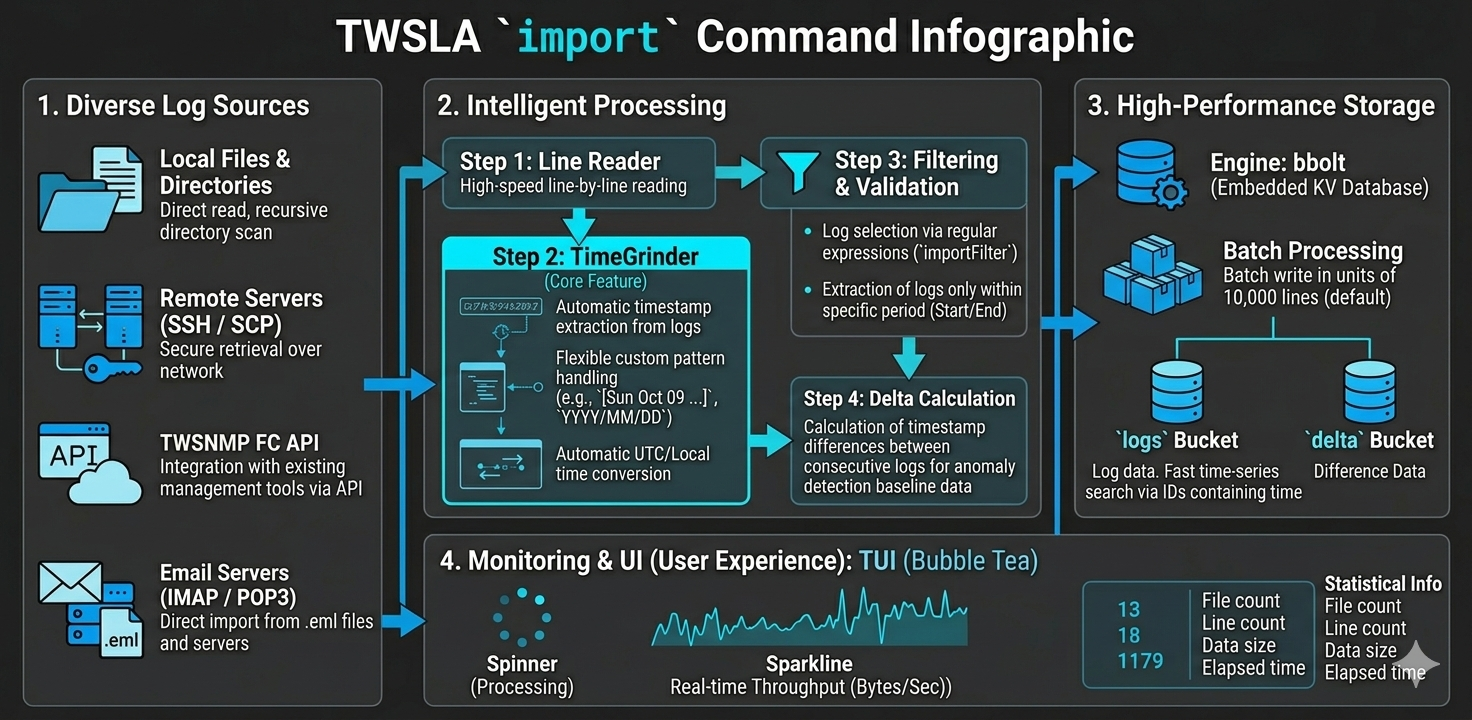
This command imports logs and saves them in a searchable time-series database. The command arguments are:
$twsla help import
Import log from source
source is file | dir | scp | ssh | twsnmp | imap | pop3 | loki | es | opensearch | twlogeye

Usage:
  twsla import [flags]

Flags:
      --api                    TWSNMP FC API Mode
  -c, --command string         SSH Command
      --emailPassword string   IMAP or POP3 password
      --emailTLS               IMAP use start TLS
      --emailUser string       IMAP or POP3 user name
  -p, --filePat string         File name pattern
  -h, --help                   help for import
      --imapFolder             List IMAP folder names
  -k, --key string             SSH Key
  -l, --logType string         TWSNNP FC log type (default "syslog")
      --noDelta                Disable delta check
      --noTS                   Import no time stamp file
  -b, --size int               Batch Size (default 10000)
      --skip                   TWSNMP FC API skip verify certificate (default true)
  -s, --source string          Log source
      --tls                    TWSNMP FC API TLS
      --utc                    Force UTC
      --mlStart string         Multiline log start pattern (regex)
      --mlSep string           Multiline log separator pattern (regex)
      --mlLines int            Multiline log fixed lines
      --mlInspect              Inspect log to suggest multiline settings

Global Flags:
      --config string      config file (default is $HOME/.twsla.yaml)
  -d, --datastore string   Log DataStore path (.db, .badger, .parquet) (default "./twsla.db")
  -f, --filter string      Simple filter
  -v, --not string         Invert regexp filter
  -r, --regex string       Regexp filter
      --sixel              show chart by sixel
  -t, --timeRange string   Time range
Starting from v1.22.0, support for importing multiline logs has been added. You can specify how to combine lines using the following options:
--mlStart 'regex': Specifies the pattern for the start of a log entry. Subsequent lines are combined into a single entry until the next start pattern is found.--mlSep 'regex': Specifies the pattern for the separator line between log entries.--mlLines number: Combines a fixed number of lines into a single log entry.
If you are unsure which setting to use, run with the --mlInspect flag. It will analyze the beginning of the log and suggest the recommended settings.
$ twsla import -s testlog/multi.log --mlInspect
Inspecting testlog/multi.log...
Found 4 timestamps in 9 lines.
Suggested settings:
  --mlStart '^\d{4}/\d{2}/\d{2}'
  --mlLines 3
Specify the location of the log to read with -s or --source.
In the latest version, you can specify files and directory names as arguments without the -s option.
If you specify a file, only that file will be read.
If it runs:
$twsla import ~/Downloads/SSH.tag.gz
┌─────────────────────────────────────────────────────────────────────────────────────────┐
│/ Loading path=/Users/ymi/Downloads/SSH.tar.gz:SSH.log line=655,147 byte=72 MB           │
│  Total file=1 line=655,147 byte=72 MB time=1.709061625s                                 │
│▆▆▆▆▆▆▆▆▆▆▆▆▇▇▇▇▇▇▇▇▇▇▇▇▇▇▇▇▇▇▇▇▇▇▇▇▇▇▇▇▇▇▇▇▇▇▇▇▇▇▇▇▇▇█████████████████████████ 72 MB/Sec│
└─────────────────────────────────────────────────────────────────────────────────────────┘
It displays the number of logs, size, and the time taken.
When you specify a directory, it reads the files in that directory. If you specify a file pattern with -p or --filePat, you can limit the files read from the directory. This uses a simple filter.
$twsla import -s ~/Downloads -p "Linux*"

/ Loading path=/Users/ymimacmini/Downloads/Linux_2k.log line=2,000 byte=212 kB
  Total file=1 line=2,000 byte=212 kB time=75.410115ms
Starting with v1.17.0, the import status display has changed.

Displays sparklines.
You can also specify the filename pattern when reading from a ZIP or Tar.gz file.
When reading, you can specify a simple filter, regular expression filter, and time range to reduce the amount of data imported.
To read SCP, SSH, or TWSNMP logs, specify the URL:
scp://root@192.168.1.210/var/log/messages
SSH key is required.
Compatible with TWSNMP FC’s web API from v1.4.0.
Specify twsnmp://192.168.1.250:8080 in the URL of the -s option.
If you specify --api, you can import logs via the Web API.
--logType can also obtain logs other than syslog.
From v1.20.0, support for importing from IMAP, POP3, and email files (.eml) has been added.
To import from an IMAP server:
imap://user:password@imap.example.com:993/INBOX
To list IMAP folders:
twsla import --imapFolder -s imap://user:password@imap.example.com:993
To import from a POP3 server:
pop3://user:password@pop3.example.com:995
You can also specify user and password via flags:
twsla import -s imap://imap.example.com --emailUser user --emailPassword password --emailTLS
To import from an email file (.eml):
twsla import sample.eml
To import from twlogeye:
twlogeye://192.168.1.1:8081
twlogeye://192.168.1.1:8081/logs/syslog
Flags: --twlogeyeTarget, --twlogeyeSubTarget, --twlogeyeLevel, --twlogeyeAnomaly, --ca, --cert, --key.
To import from Grafana Loki:
loki://192.168.1.1:3100 or lokis://...
Flags: --lokiQuery (LogQL query), --lokiOrgId (tenant ID), --lokiToken (Bearer token).
To import from Elasticsearch / OpenSearch:
es://user:pass@192.168.1.1:9200/logs-*
opensearch://user:pass@192.168.1.1:9200/logs-*
Flags: --esIndex, --esQuery, --esTimeField (default @timestamp), --esMessageField (default message), --esApiKey.
To import from an FTP / FTPS server:
ftp://user:pass@192.168.1.1/var/log/syslog
ftp://192.168.1.1/logs/ (Use -p "syslog*" to filter filenames in directories)
ftps://user:pass@192.168.1.1/var/log/syslog
Flags: --ftpUser (default anonymous), --ftpPassword (default anonymous@), --ftpTLS (enable Explicit TLS), --ftpSkip (skip TLS cert verification, default true).
.gz compressed logs are automatically decompressed during stream import.
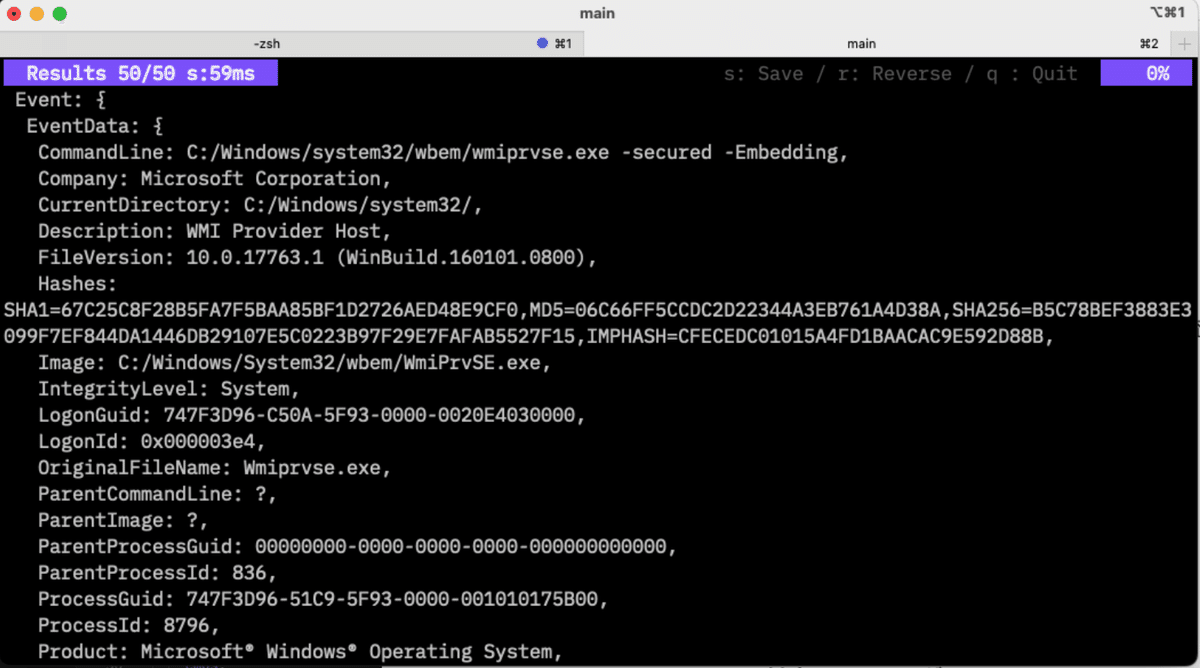
If you specify --json when reading an EVTX file from v1.1.0, the Windows event log is read in JSON format, allowing detailed information to be displayed.
The log destination is specified with the -d option (bbolt .db, Badger .badger, or Parquet .parquet datastore). If you omit it, it defaults to twsla.db in the current directory.
By specifying --noDelta from v1.8.0, it is possible to skip the time difference calculation to speed up the process.
Importing is faster when logs are in chronological order. Random logs are slower.
search command
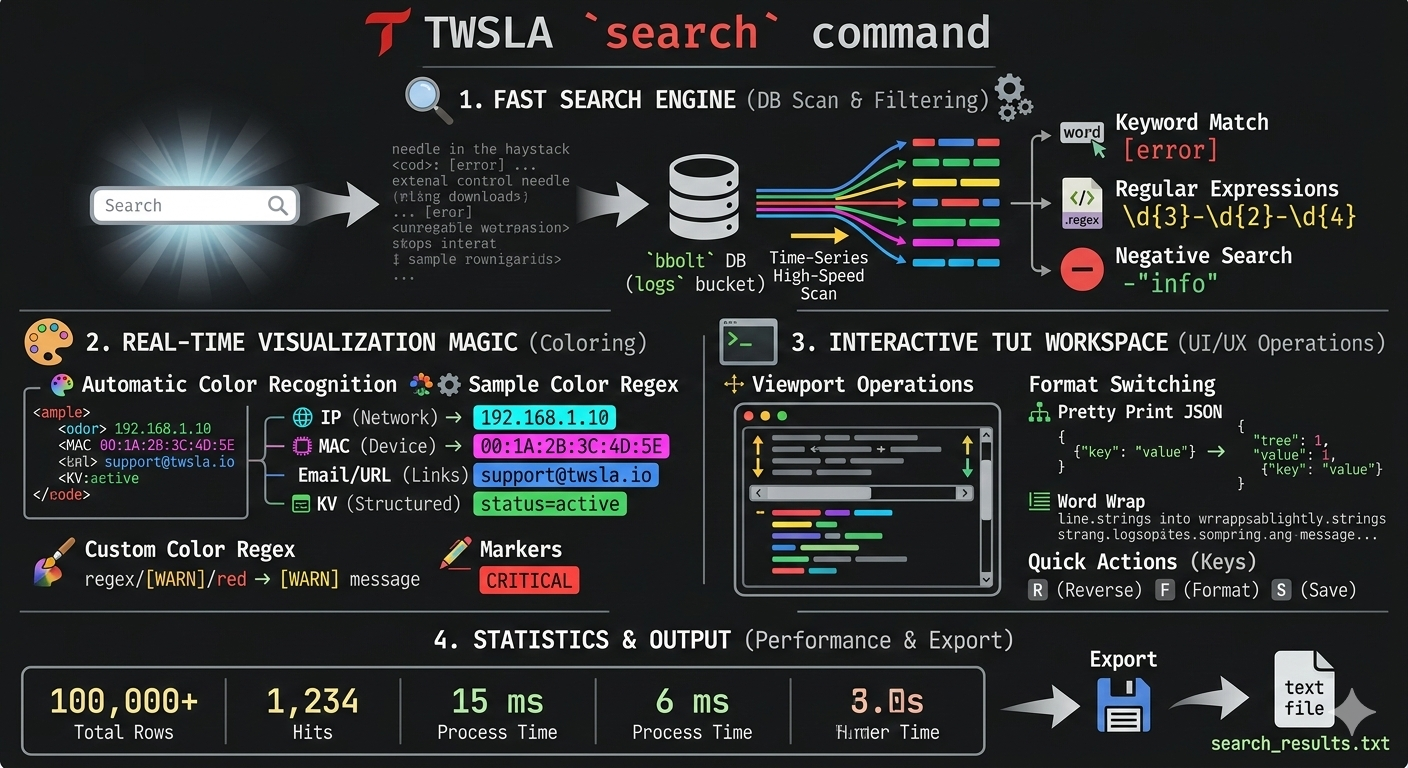
You can search once the logs are imported.
twsla help search
Search logs.
Simple filters, regular expression filters, and exclusion filters can be specified.

Usage:
  twsla search [flags]

Flags:
  -c, --color string   Color mode
  -h, --help           help for search

Global Flags:
      --config string      config file (default is $HOME/.twsla.yaml)
  -d, --datastore string   Log DataStore path (.db, .badger, .parquet) (default "./twsla.db")
  -f, --filter string      Simple filter
  -v, --not string         Invert regexp filter
  -r, --regex string       Regexp filter
  -t, --timeRange string   Time range
You can narrow down the logs by specifying a simple filter, regular expression filter, and time range. In the current version, it acts as an inverted filter when starting with a simple filter argument.
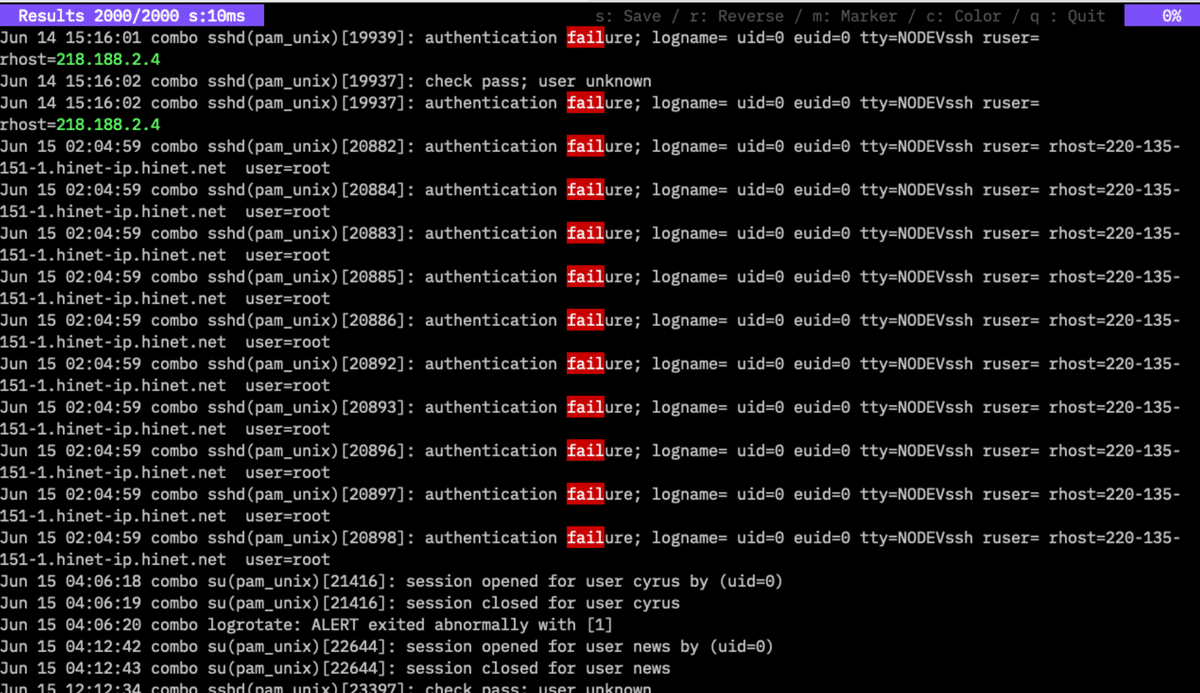
$twsla search -f fail
Example search:
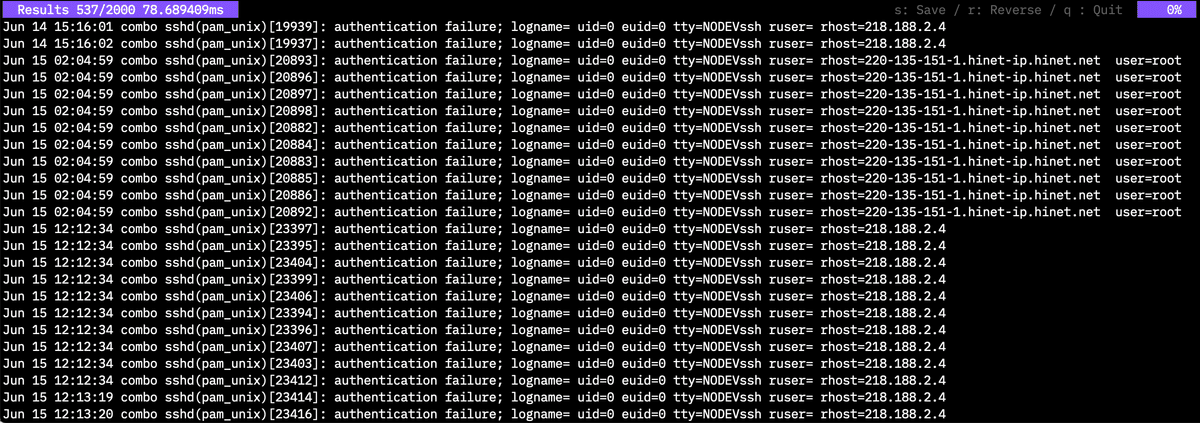
A key input help is displayed at the top right of the search result screen.
You can save the result with the S key. The display is reversed with the R key. Q key exits.
Log search results can be color-coded since v1.5.0.
Specify -c or --color as an option for the search command. For the key:
| Key | Description |
|---|---|
| IP | Color display of IP address |
| Mac | Color display of MAC address |
| Color display of email address | |
| URL | Color display of URL |
| Filter | Color display of the string specified in the filter |
| REGEXP/Pattern/Color | Display the string that matches the regular expression in the specified color |
Example:
twsla search -f Failed -c "regex/user\s+\S+/9,ip,filter"
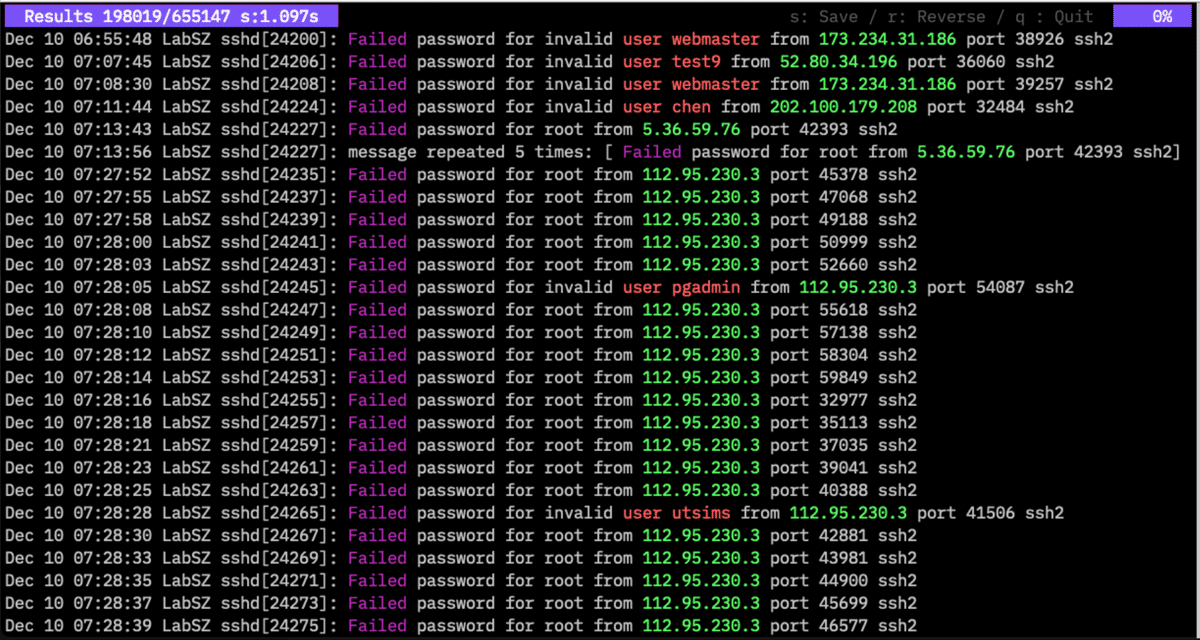
From v1.6.0, you can specify color displays from the search results screen.
Press the C key to display the input screen. When you press the M key:
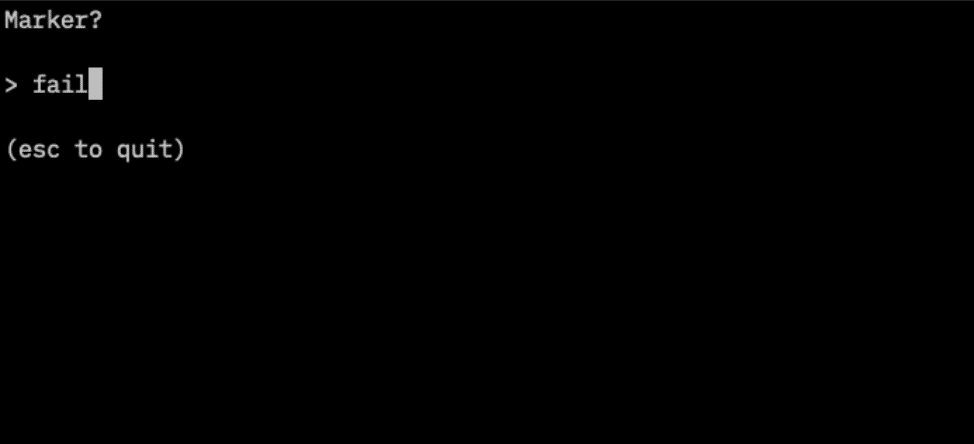
Displays the marker input screen. Following simple filter or regex:, you can specify a regular expression filter and mark the corresponding strings in the log. This is an example of an IP color and a marker for “Fail”.
count command
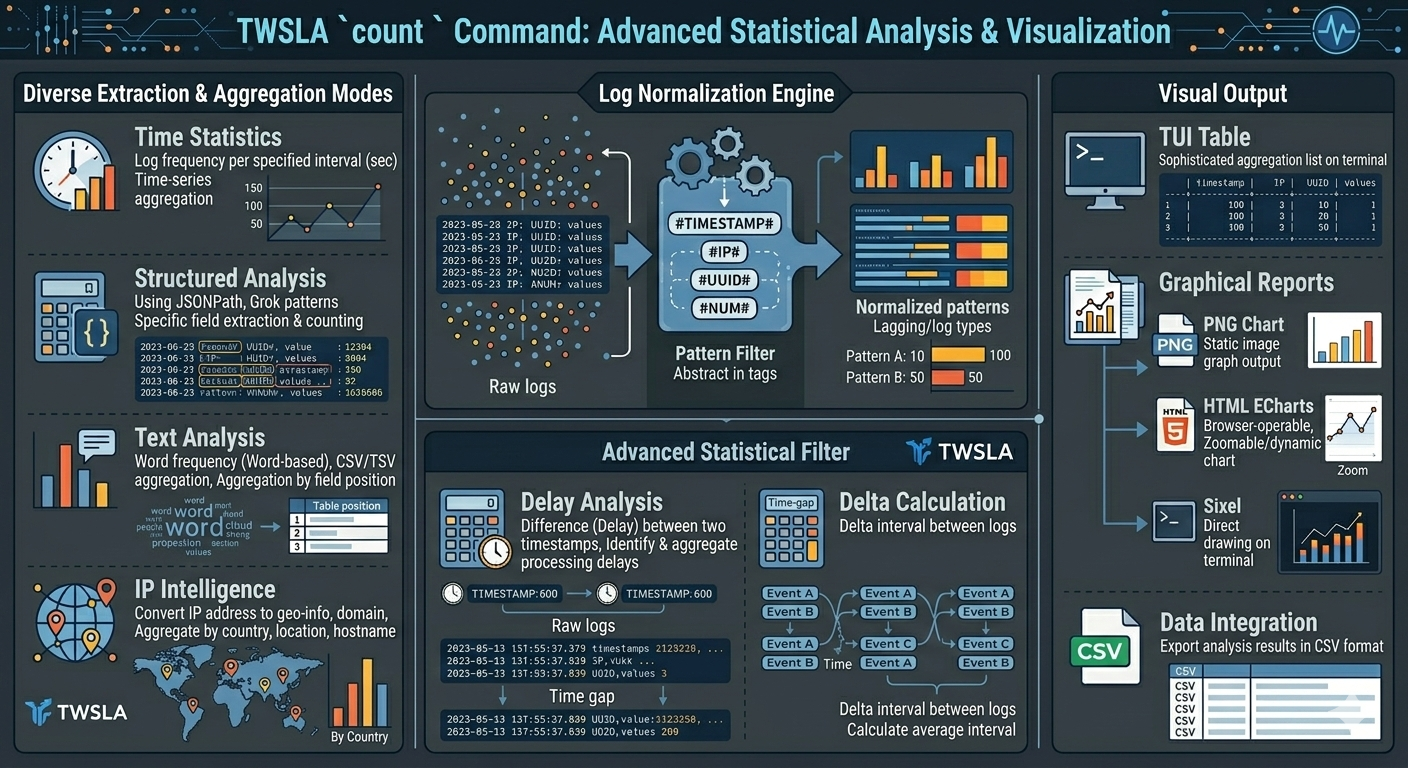
This command aggregates the number of logs on an hourly basis, or uses data extracted from the log as a key.
$twsla help count
Count the number of logs.
Count logs for each specified period.
Number of occurrences of items extracted from the log.
Count normalized logs by pattern:
 $twsla count -e normalize
Count words in logs:
 $twsla count -e word
Count JSON keys:
 $twsla count -e json -n Score

Usage:
  twsla count [flags]

Flags:
      --delay int        Delay filter
  -e, --extract string   Extract pattern or mode. mode is json,grok,word,normalize
      --geoip string     geo IP database file
  -g, --grok string      grok pattern definitions
  -x, --grokPat string   grok pattern
  -h, --help             help for count
  -i, --interval int     Specify the aggregation interval in seconds.
      --ip string        IP info mode(host|domain|loc|country)
  -n, --name string      Name of key
  -p, --pos int          Specify variable location (default 1)
  -q, --timePos int      Specify second time stamp position
      --utc              Force UTC

Global Flags:
      --config string      config file (default is $HOME/.twsla.yaml)
  -d, --datastore string   Log DataStore path (.db, .badger, .parquet) (default "./twsla.db")
  -f, --filter string      Simple filter
  -v, --not string         Invert regexp filter
  -r, --regex string       Regexp filter
      --sixel              show chart by sixel
  -t, --timeRange string   Time range
You can filter in the same way as search.
If an extraction pattern is specified with the -e option, the data is aggregated by those units. If omitted, logs are aggregated by time.
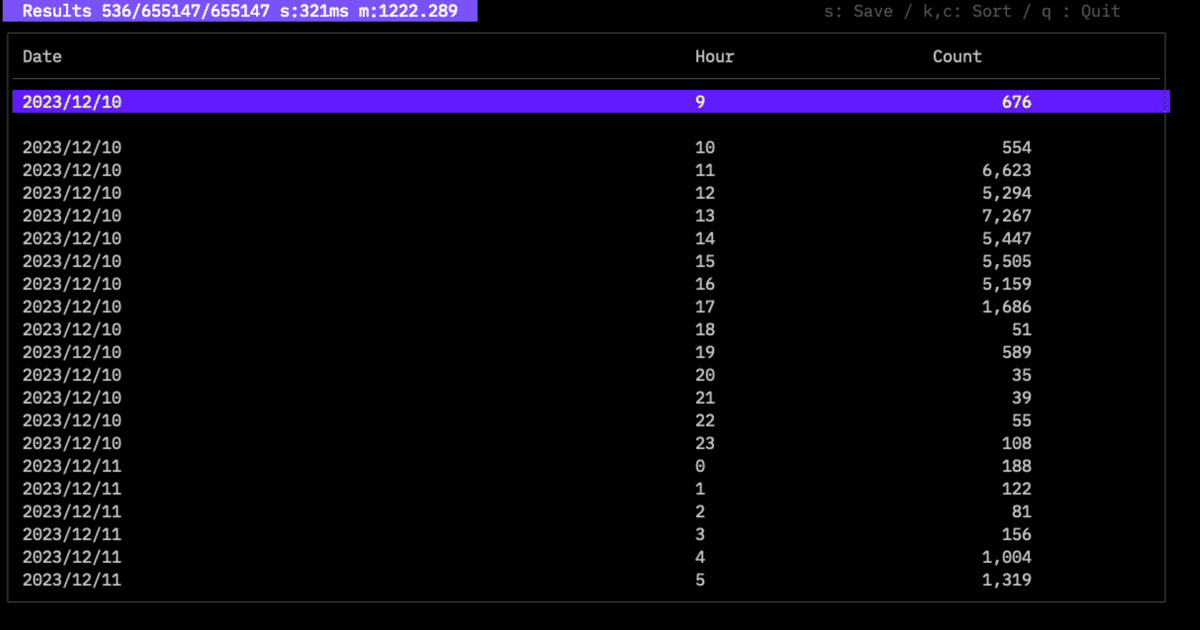
Hourly aggregation:
$twsla count -f fail
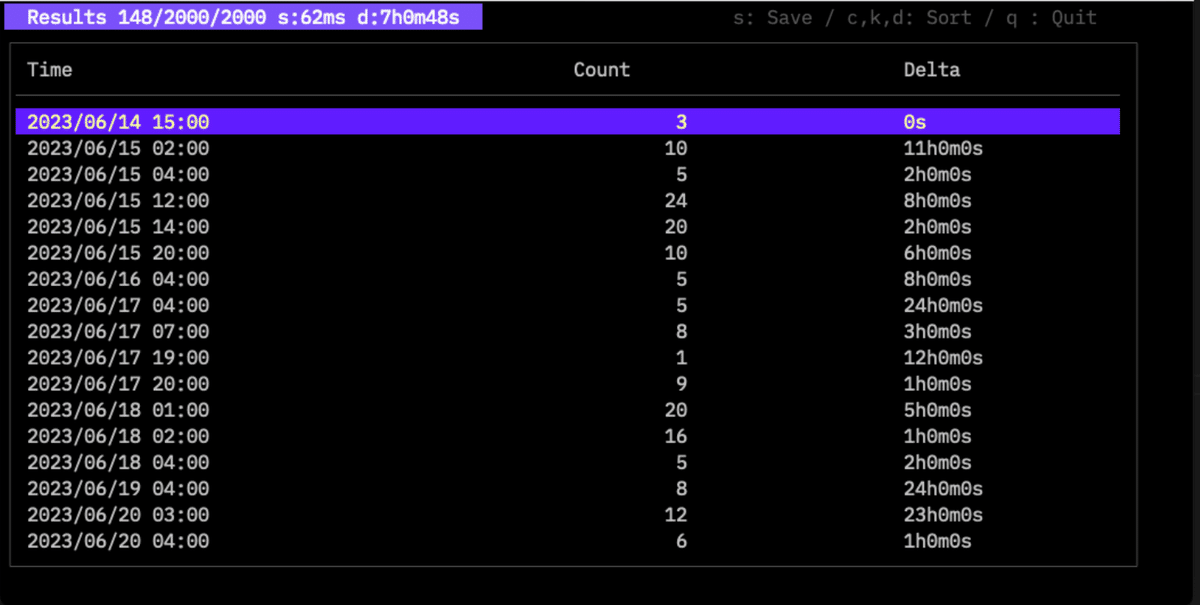
The time interval is specified with the -i option. If omitted, it is set automatically.
From v1.1.0, the time difference (Delta) from the previous log is also displayed. The average interval is shown at the top.
You can sort by count with the C key, or by time with the K key.
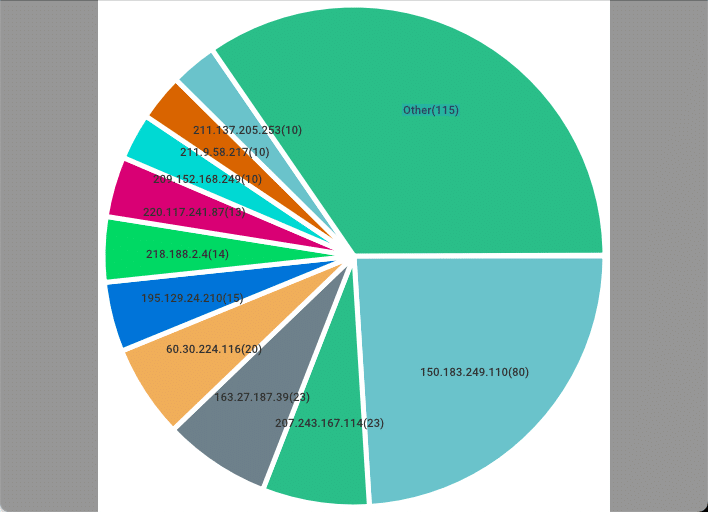
You can save the result with the S key. Saving with a .png extension will generate a graph.
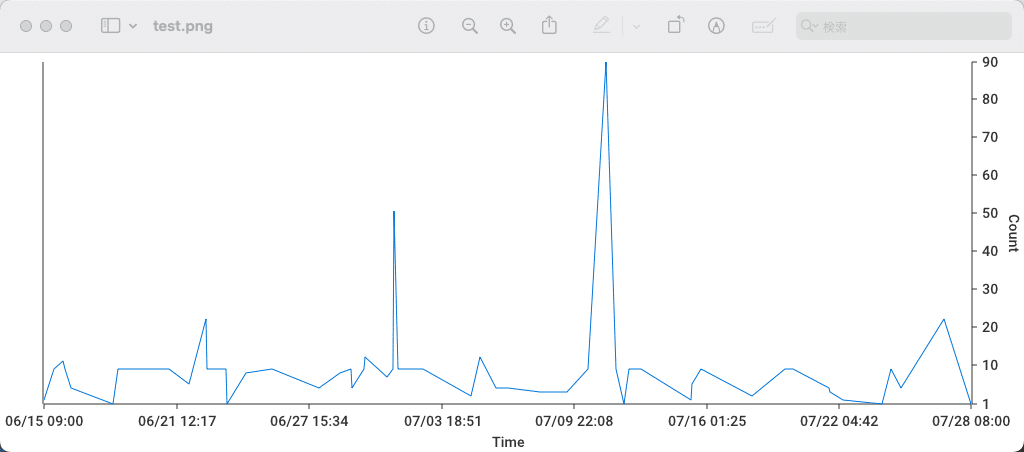
From v1.5.0, you can save interactive graphs by using the .html extension.
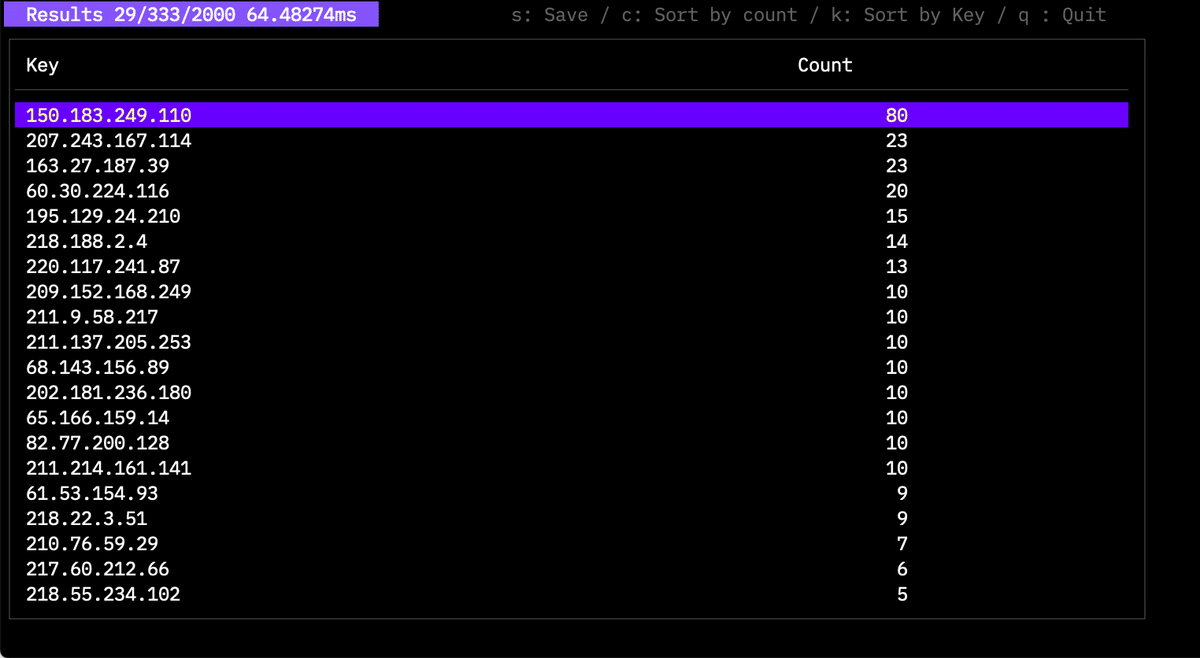
The TOP10 ratio graph looks like this:
A delay time filter was added in v1.16.0.
--delay <number>
Specifying this will cause the command to display logs with a delay higher than the specified number.
  -q, --timePos int      Specify second time stamp position
      --utc              Force UTC
This mode detects the time difference between two timestamps in the log, similar to the delay command.
email command
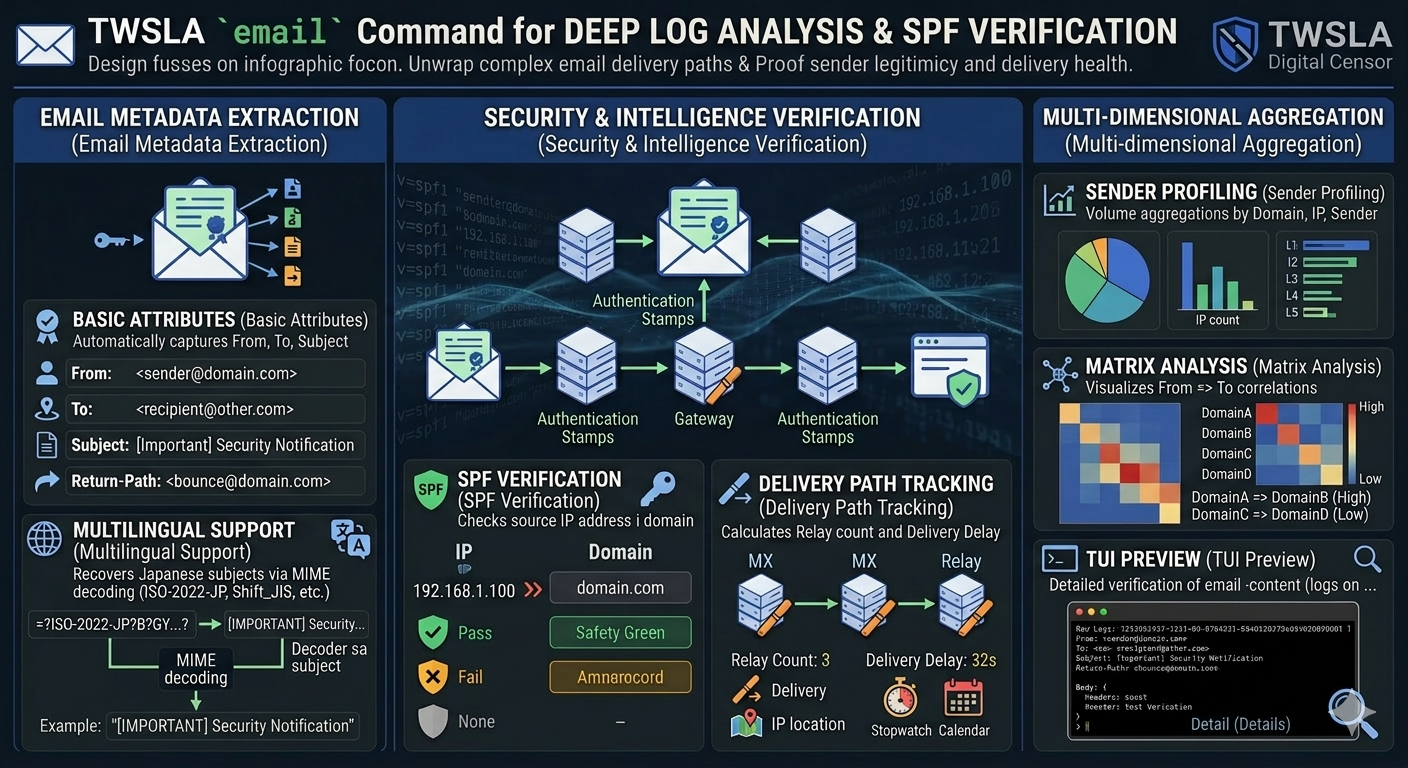
This command allows searching and counting email logs stored in the database.
It provides subcommands to search for specific emails or count emails by various fields such as From, To, Subject, Sender IP, and SPF status.
In the search results, you can check the delay time and relay count calculated from the email headers.
You can sort by delay with the d key and by relay count with the r key.
twsla email [search|count]
Examples:
  twsla email search -t "last 1h"
  twsla email count --emailCountBy from -t "last 24h"
extract command
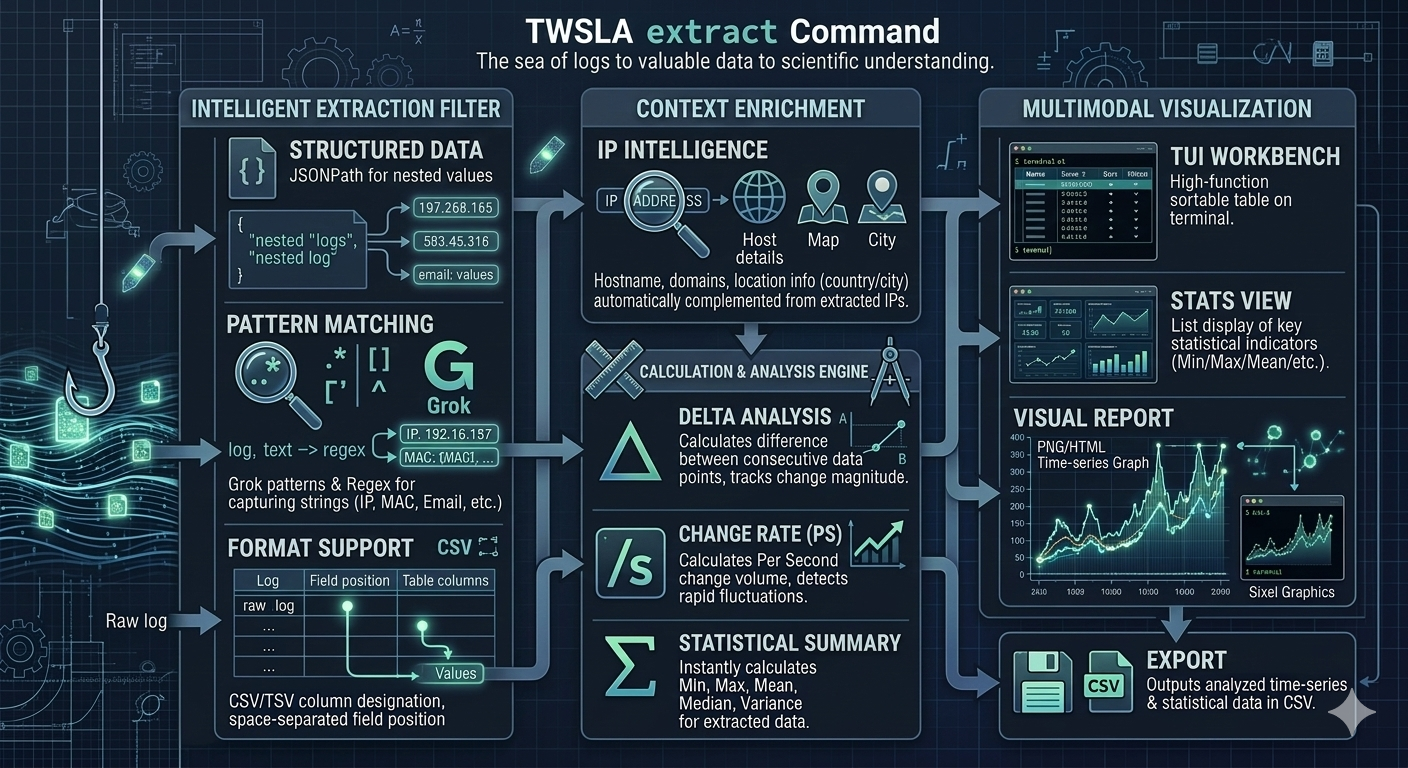
This command extracts specific data from the logs.
$twsla help extract
Extract data from the log.
Numeric data, IP addresses, MAC addresses, email addresses,
words, etc. can be extracted.

Usage:
  twsla extract [flags]

Flags:
  -e, --extract string   Extract pattern
      --geoip string     geo IP database file
  -h, --help             help for extract
  -n, --name string      Name of value (default "Value")
  -p, --pos int          Specify variable location (default 1)

Global Flags:
      --config string      config file (default is $HOME/.twsla.yaml)
  -d, --datastore string   Log DataStore path (.db, .badger, .parquet) (default "./twsla.db")
  -f, --filter string      Simple filter
  -v, --not string         Invert regexp filter
  -r, --regex string       Regexp filter
  -t, --timeRange string   Time range
You can specify the same filters as the search command. Data extraction patterns are specified the same way as the count command.
$twsla extract -f fail -e ip
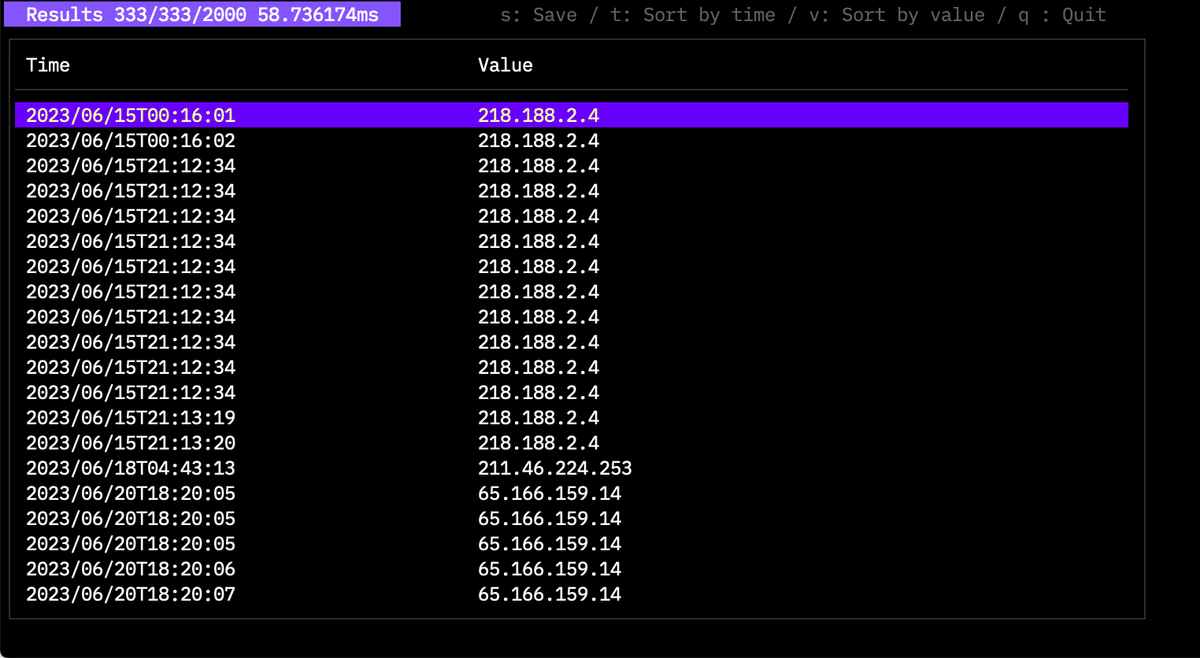
This displays time-series data. You can sort by key and save results as a graph.
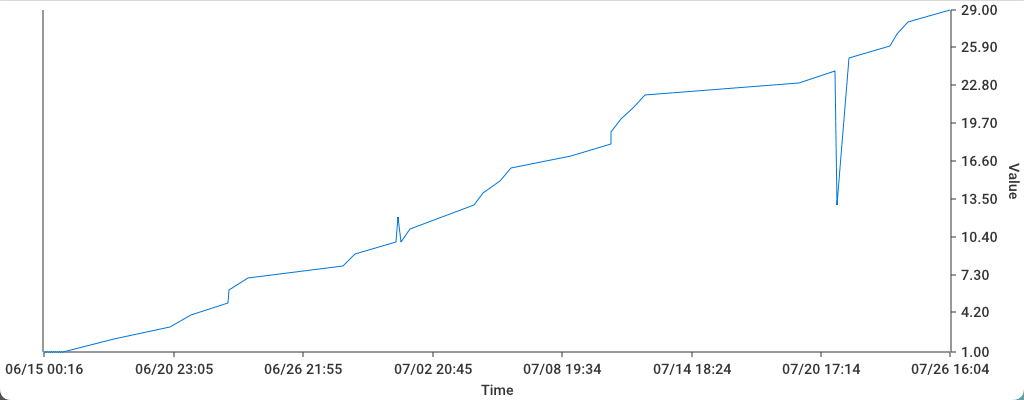
Numerical data is graphed directly, while items like IP addresses are graphed by occurrence count.
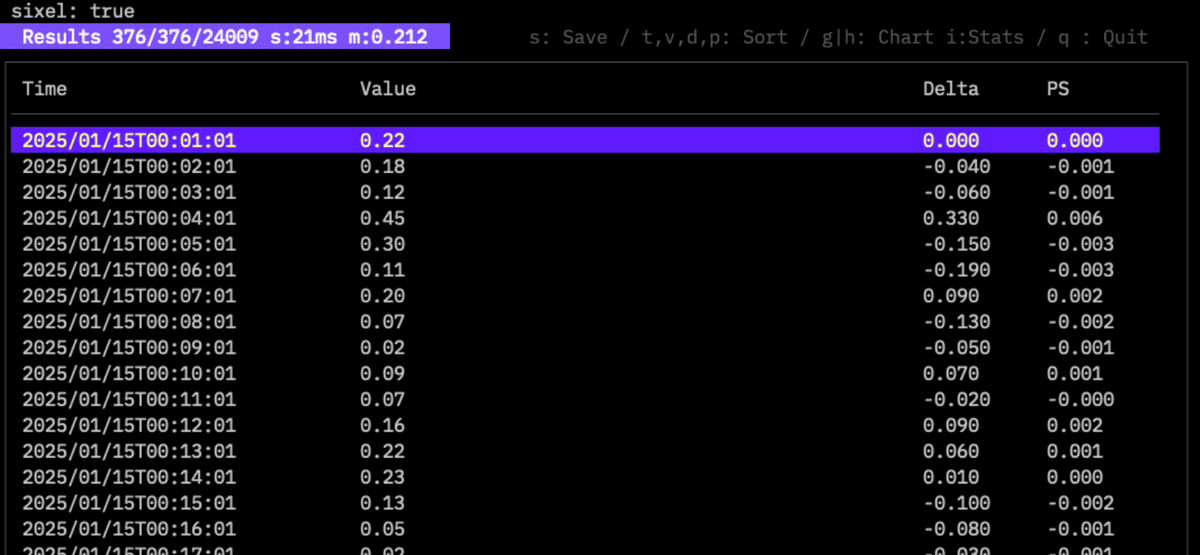
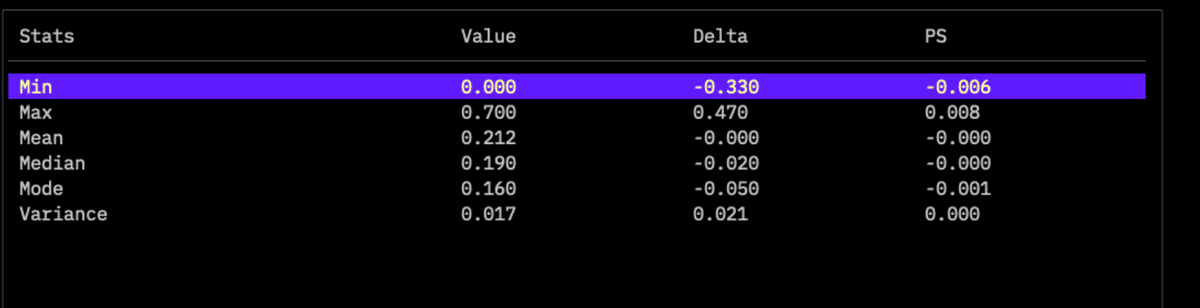
Press the i key while numerical data is extracted to display statistical information.
Press the s key to save as CSV.
tfidf command
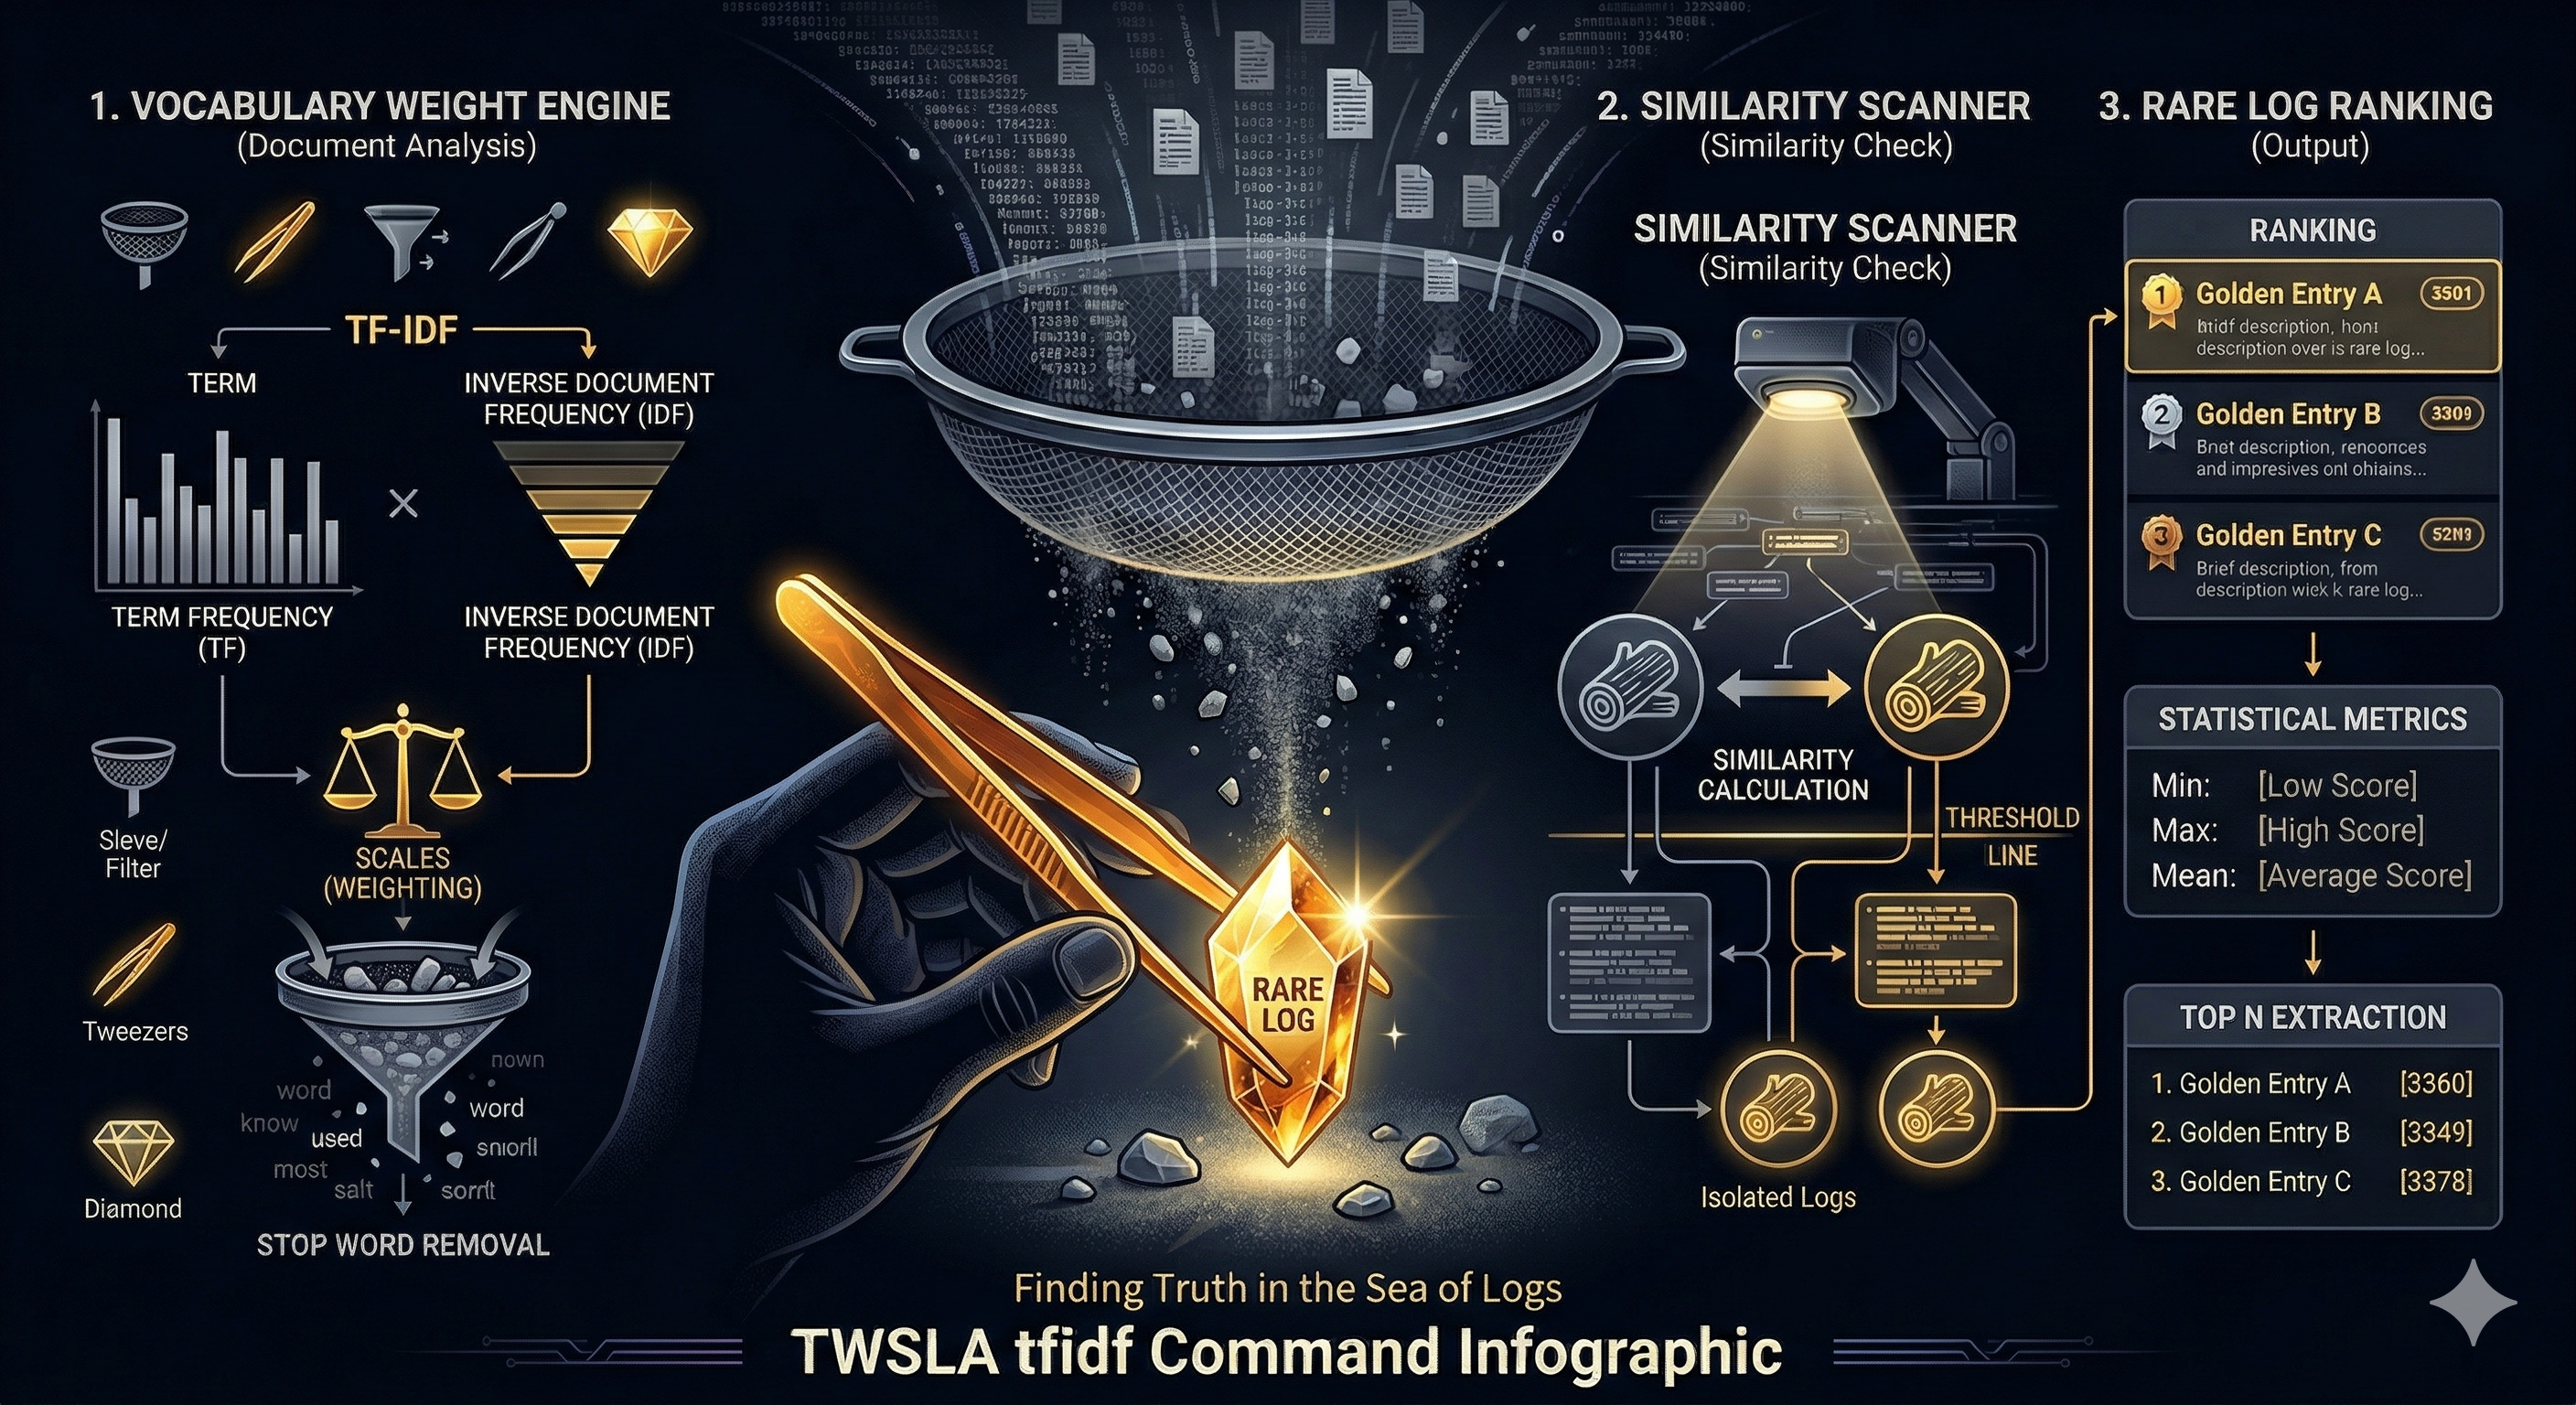
Find rare logs using TF-IDF.
$twsla help tfidf
Use TF-IDF to find rare logs.
You can specify a similarity threshold and the number of times the threshold is allowed to be exceeded.

Usage:
  twsla tfidf [flags]

Flags:
  -c, --count int     Number of threshold crossings to exclude
  -h, --help          help for tfidf
  -l, --limit float   Similarity threshold between logs (default 0.5)
  -n, --top int       Top N
      --noGPU         Disable GPU acceleration and use CPU/SIMD only

Global Flags:
      --config string      config file (default is $HOME/.twsla.yaml)
  -d, --datastore string   Log DataStore path (.db, .badger, .parquet) (default "./twsla.db")
  -f, --filter string      Simple filter
  -v, --not string         Invert regexp filter
  -r, --regex string       Regexp filter
  -t, --timeRange string   Time range
TF-IDF all-pairs cosine similarity calculation is accelerated via GPU (Metal / WebGPU) and SIMD (AVX2) matrix multiplication ($S = X \cdot X^T$), enabling rapid comparison across thousands of logs. Use --noGPU (or --no-gpu) to disable GPU and run in CPU/SIMD mode.
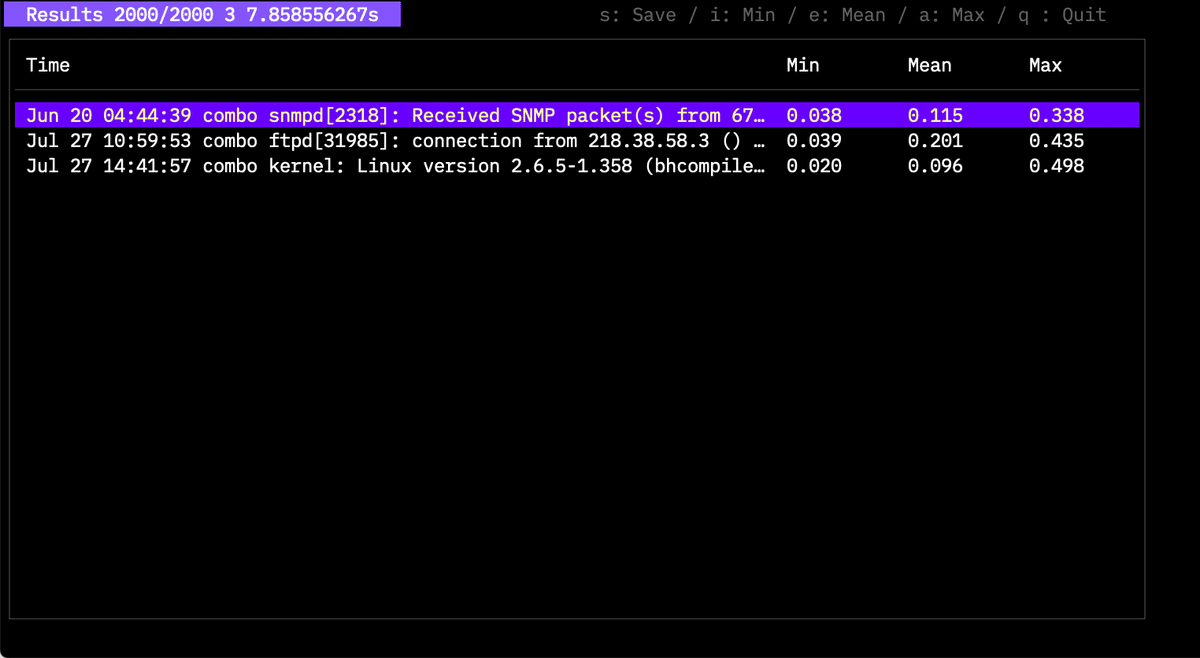
The example shows three rare logs found in 2,000 entries. Thresholds can be adjusted with -l and -c. Detailed information for experts will be provided in another article.
Since v1.10, you can use -n to get the top N rare cases.
anomaly command
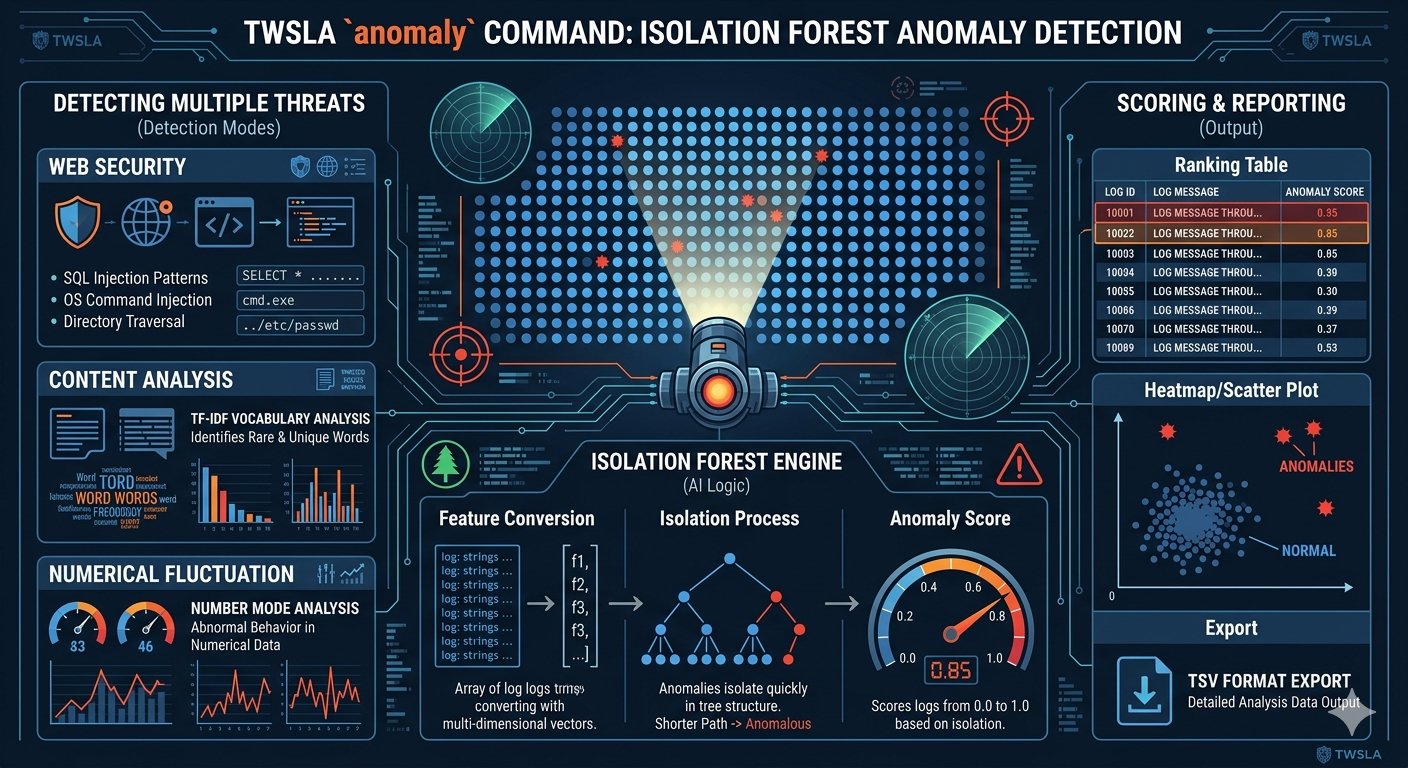
Added in v1.1.0 and enhanced in v2.0.0, this command analyzes logs to find anomalies using various machine learning and statistical algorithms.
Anomaly log detection
Detect anomaly logs using various machine learning and statistical algorithms.

Feature Extraction Modes (-m, --mode):
  tfidf:       TF-IDF vectorized log tokens for finding rare/unusual log patterns (default)
  sql:         SQL injection detection features (UNION, SELECT, SQL syntax keywords)
  os:          OS command injection detection features (/bin/sh, cmd.exe, shell commands)
  dir:         Directory traversal detection features (../, /etc/passwd, path traversal)
  walu:        Web Access Log Unified composite features (status, method, latency, path)
  number:      Numerical values extracted from logs (specify position with -e pattern)

Algorithms (-a, --algo):
  iforest:     Isolation Forest outlier detection (tree-based) (default)
  autoencoder: Deep Learning Autoencoder via tensai (reconstruction loss)
  lstm:        Sequential transition anomaly detection via tensai
  lof:         Local Outlier Factor (density-based outlier detection)
  knn:         k-Nearest Neighbor distance (distance-based anomaly detection)
  mahalanobis: Mahalanobis distance (multivariate covariance outlier detection)
  zscore:      Statistical Z-Score (standard deviation deviations)

Usage:
  twsla anomaly [flags]

Flags:
  -a, --algo string      Anomaly algorithm: iforest, autoencoder, lstm, lof, knn, mahalanobis, zscore (default "iforest")
  -e, --extract string   Extract pattern for number mode (e.g. start*end)
  -h, --help             help for anomaly
  -m, --mode string      Detection modes: tfidf, sql, os, dir, walu, number (default "tfidf")
      --noGPU            Disable GPU acceleration and use CPU/SIMD only

Global Flags:
      --config string      config file (default is $HOME/.twsla.yaml)
  -d, --datastore string   Log DataStore path (.db, .badger, .parquet) (default "./twsla.db")
  -f, --filter string      Simple filter
  -v, --not string         Invert regexp filter
  -r, --regex string       Regexp filter
  -t, --timeRange string   Time range
Specify feature extraction mode with -m:
tfidf: Creates log vectors using TF-IDF.sql,os, anddir: Create vectors based on keywords related to SQL injection, OS command injection, and directory traversal.walu: Extracts composite features tailored for web access logs.number: Creates vectors from numerical values in the log. Numerical positions can be specified with-e(e.g.start*end).
Specify anomaly detection algorithm with -a (--algo):
iforest(default): Isolation Forest outlier detection.autoencoder: Deep Learning Autoencoder via tensai. Reconstructs vectors and scores reconstruction loss.lstm: Recurrent sequential transition anomaly detection via tensai.lof: Local Outlier Factor (density-based outlier detection).knn: k-Nearest Neighbor average distance.mahalanobis: Multivariate Mahalanobis distance.zscore: Fast statistical Z-Score outlier detection.
start*end
Example:
11:00 start 0.1 0.2 1.4 end
Only the values between start and end will be analyzed.
Analysis results:
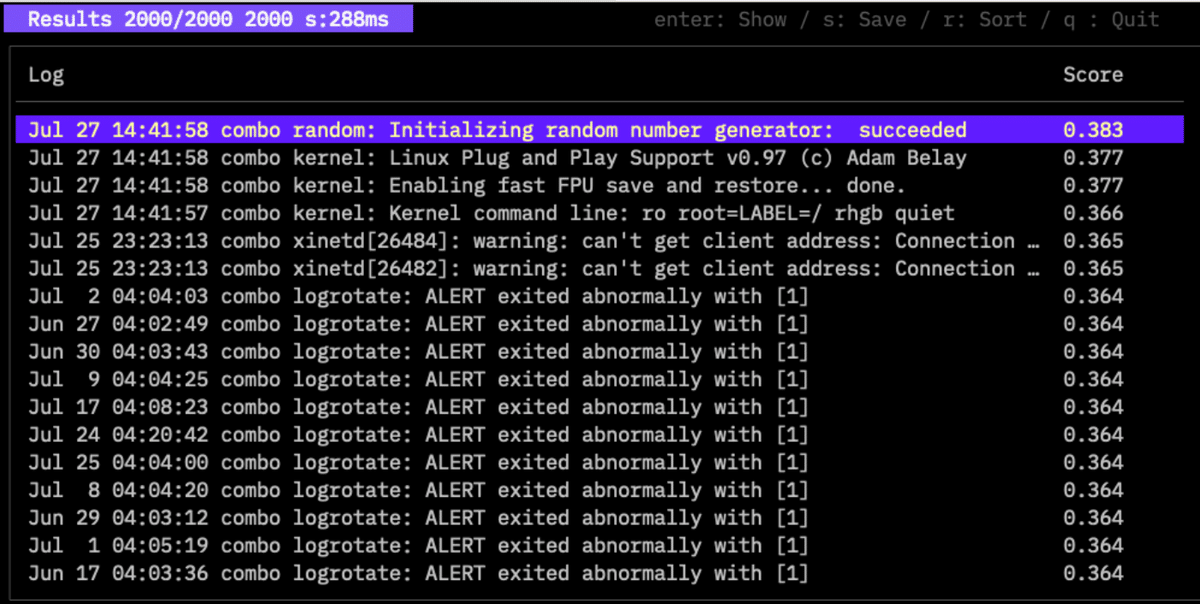
Higher scores indicate greater anomalies. sql and walu modes are effective for web server access logs.
delay command
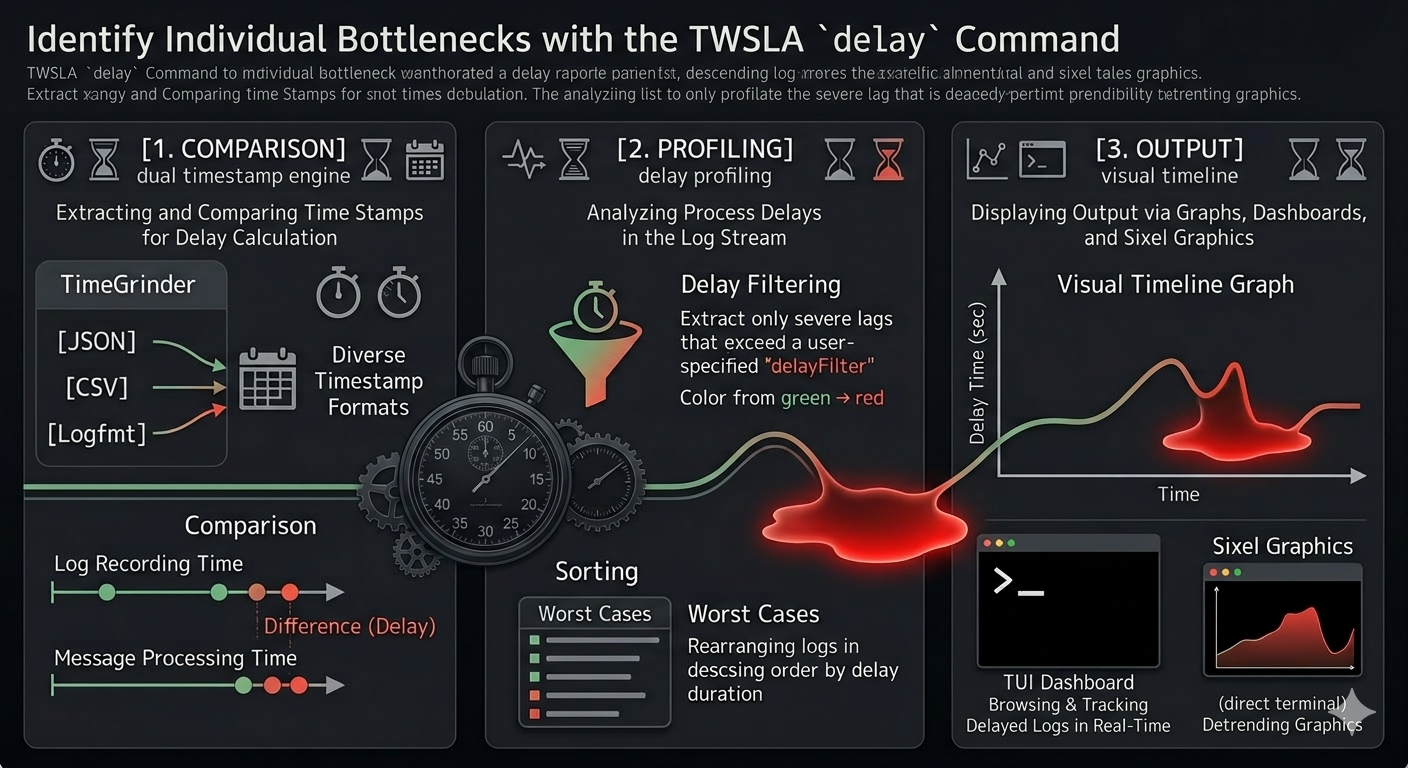
Added in v1.3.0, this command detects processing delays from access logs. Apache’s access log records the timestamp when a request is accepted, but outputs the entry after the response is sent. This can cause timestamps to appear out of order. This reversal can be used to detect delays in processing requests or downloading large files. It can also detect delays between timestamps when access logs are transferred to syslog with multiple timestamps.
Search for delays in the access log

Usage:
  twsla delay [flags]

Flags:
  -h, --help          help for delay
  -q, --timePos int   Specify second time stamp position
      --utc           Force UTC

Global Flags:
      --config string      config file (default is $HOME/.twsla.yaml)
  -d, --datastore string   Log DataStore path (.db, .badger, .parquet) (default "./twsla.db")
  -f, --filter string      Simple filter
  -v, --not string         Invert regexp filter
  -r, --regex string       Regexp filter
  -t, --timeRange string   Time range
If -q is 1 or more, it processes multiple timestamps. If omitted or 0, it detects delays using the Apache access log reversal phenomenon.
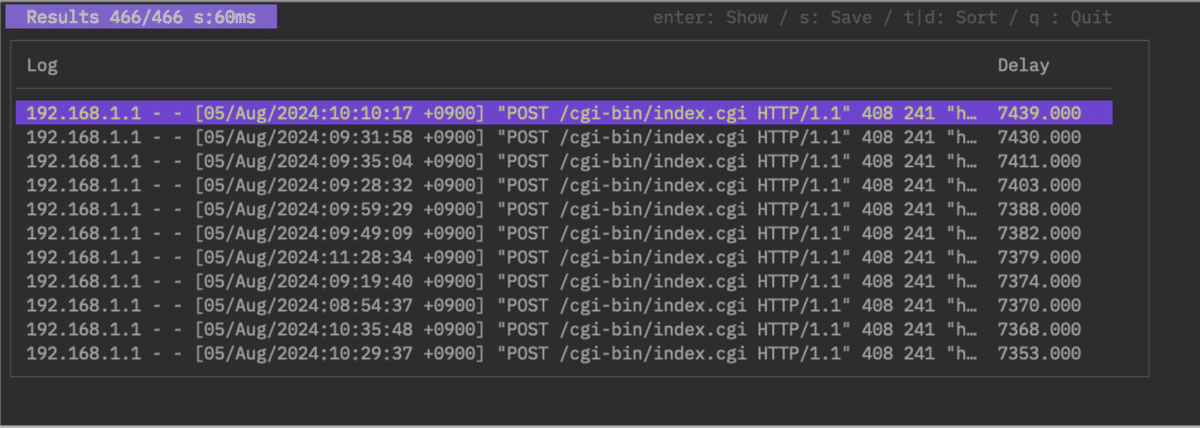
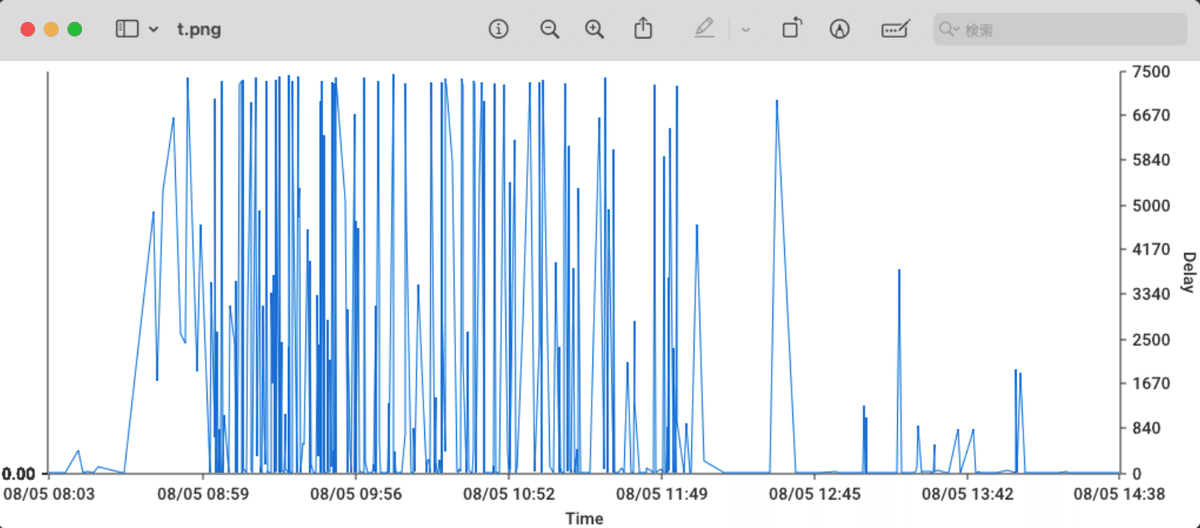
If no delays are detected, nothing is displayed. The rightmost column shows the delay time. Select a log and press Enter for details. Sort by time with T or by delay with D. Save with S; using .png saves a graph image.
twsnmp command
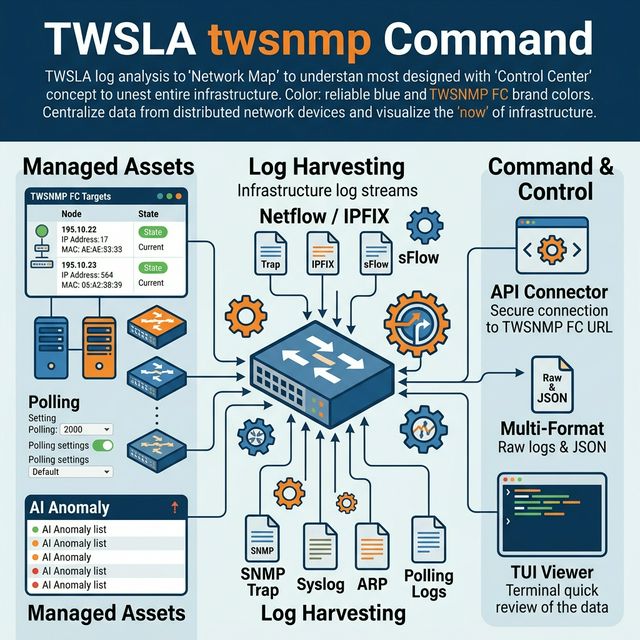
This command links with TWSNMP FC (added in v1.4.0).
Get information and logs from TWSNMP FC
[target] is node | polling | eventlog | syslog | trap |
  netflow | ipfix | sflow |sflowCounter | arplog | pollingLog

Usage:
  twsla twsnmp [target] [flags]

Flags:
      --checkCert       TWSNMP FC API verify certificate
  -h, --help            help for twsnmp
      --jsonOut         output json format
      --twsnmp string   TWSNMP FC URL (default "http://localhost:8080")

Global Flags:
      --config string      config file (default is $HOME/.twsla.yaml)
  -d, --datastore string   Log DataStore path (.db, .badger, .parquet) (default "./twsla.db")
  -f, --filter string      Simple filter
  -v, --not string         Invert regexp filter
  -r, --regex string       Regexp filter
  -t, --timeRange string   Time range
Specify the TWSNMP FC URL with --twsnmp. Include credentials if necessary:
http://user:password@192.168.1.250:8080
Example: Fetching the node list:
twsla twsnmp node --twsnmp http://192.168.1.253:8081
17ea9e198e6dce8e        eve-ng-ymi.     normal  192.168.13.1
17ea9e1c9574f616        192.168.13.2    low     192.168.13.2    00:50:79:66:68:05(Private)
...
Outputs are tab-separated text by default. Use --jsonOut for JSON format, which is useful for programmatic access.
relation command
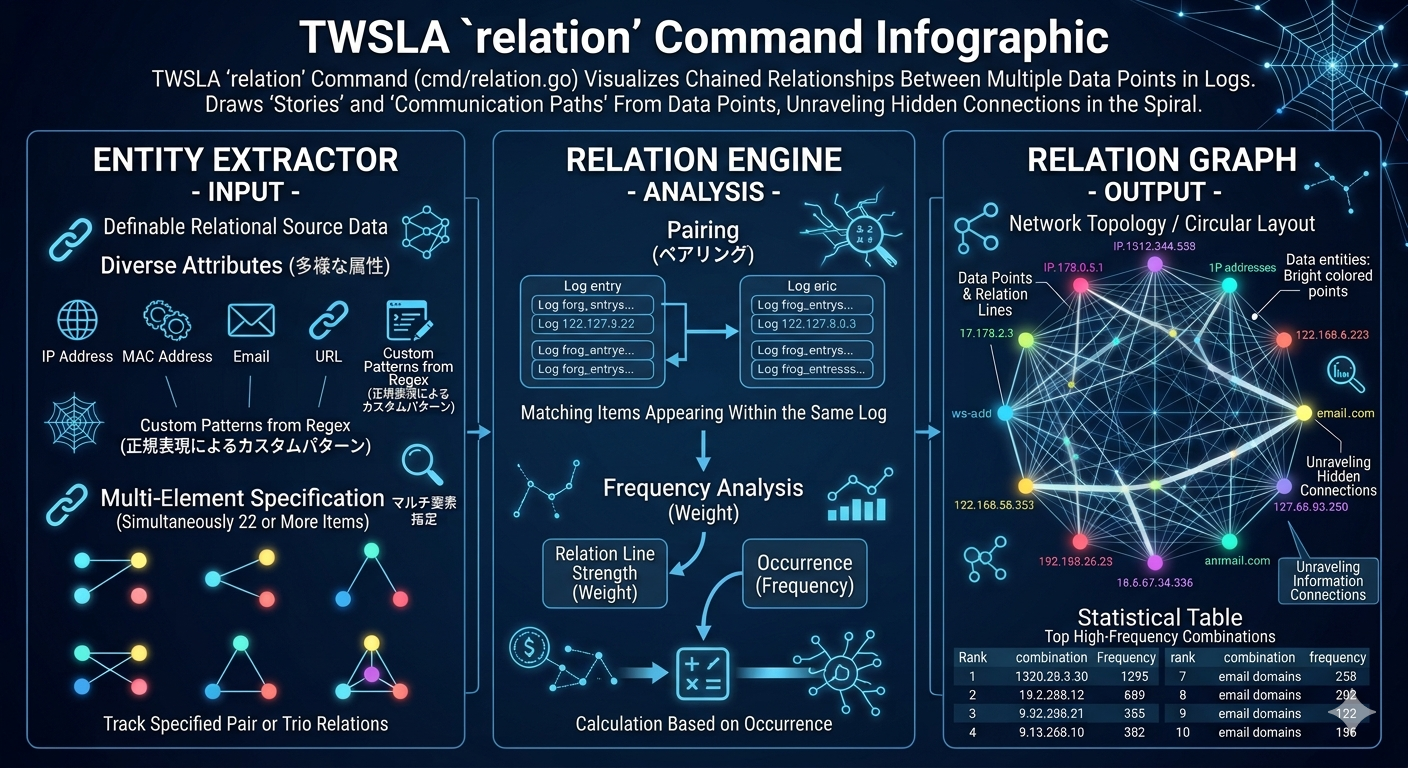
Analyzes relationships between multiple items in log lines. Results can be output as an interactive graph.
$twsla help relation
Analyzes the relationship between two or more pieces of data extracted from a log,
such as the relationship between an IP address and a MAC address.
data entry is ip | mac | email | url | regex/<pattern>/<color>

Usage:
  twsla relation <data1> <data2>... [flags]

Flags:
  -h, --help   help for relation

Global Flags:
      --config string      config file (default is $HOME/.twsla.yaml)
  -d, --datastore string   Log DataStore path (.db, .badger, .parquet) (default "./twsla.db")
  -f, --filter string      Simple filter
  -v, --not string         Invert regexp filter
  -r, --regex string       Regexp filter
  -t, --timeRange string   Time range
Supported items:
| Key | Description |
|---|---|
| IP | IP address |
| Mac | MAC address |
| Email address | |
| URL | URL |
| REGEXP/Pattern/ | String matching regular expression |
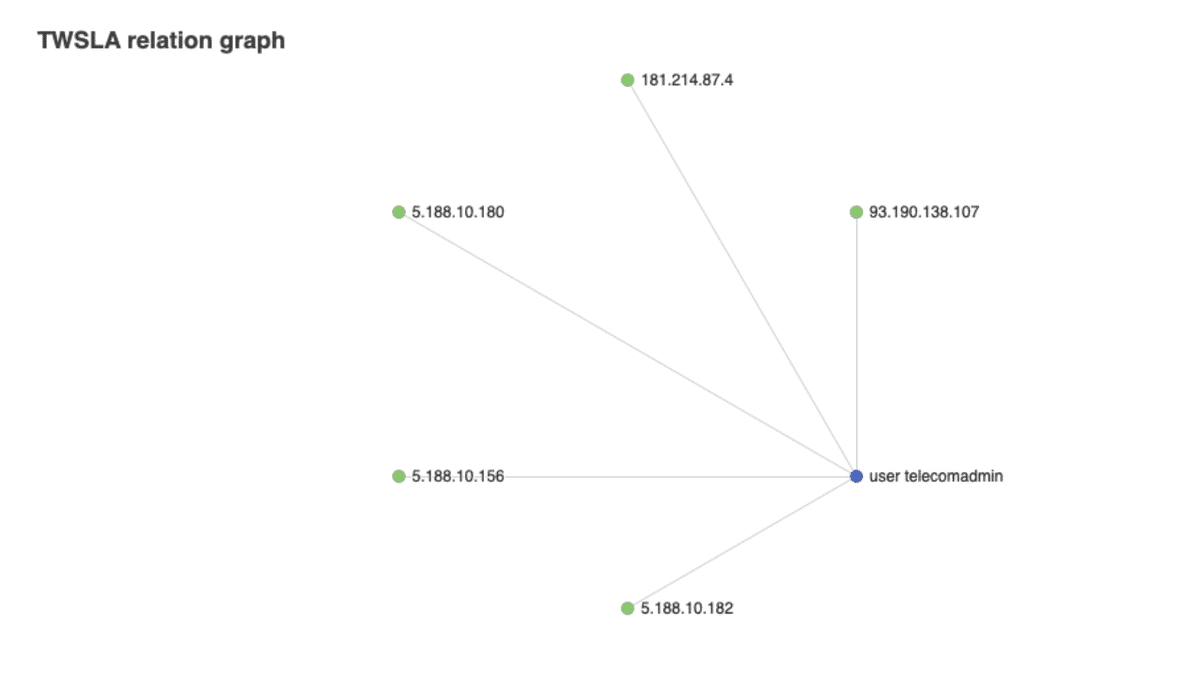
$twsla relation -f Failed -r user "regex/user\s+\S+/" ip
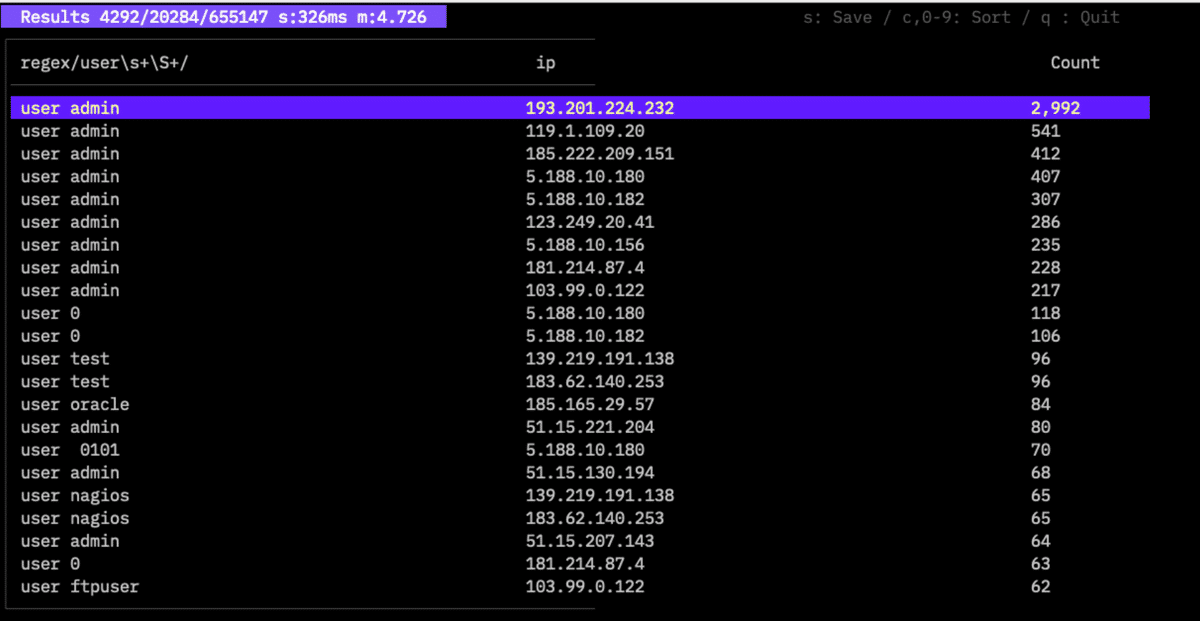
Aggregations can be viewed as an interactive graph by saving with the .html extension.
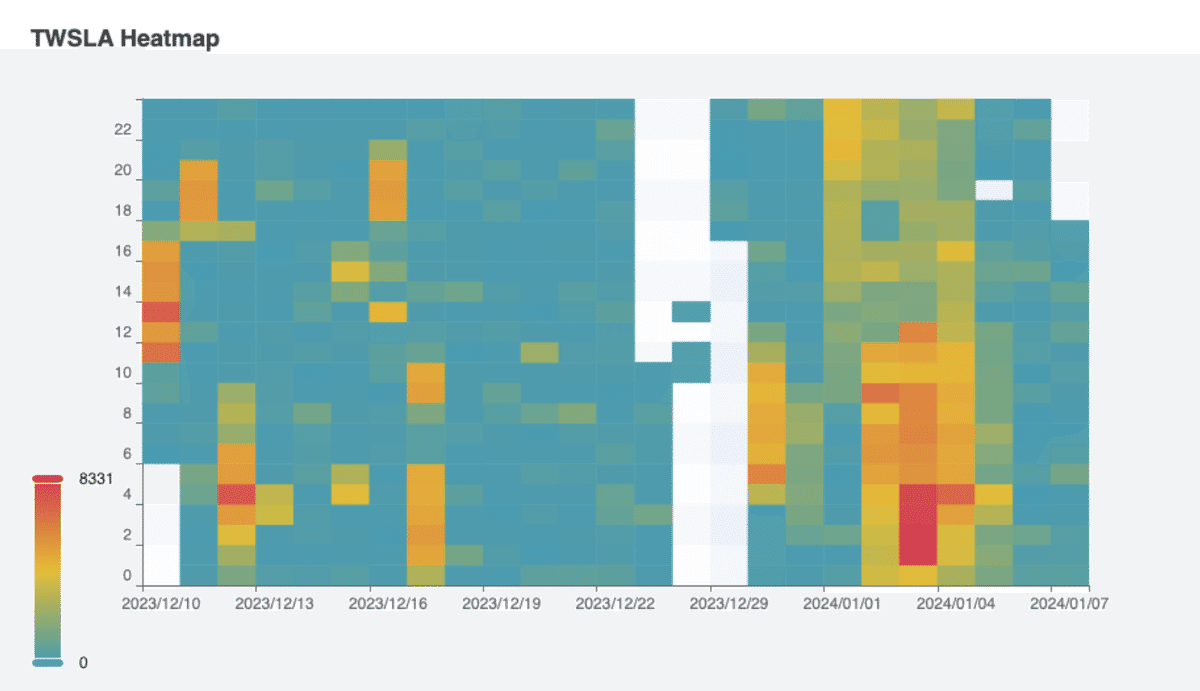
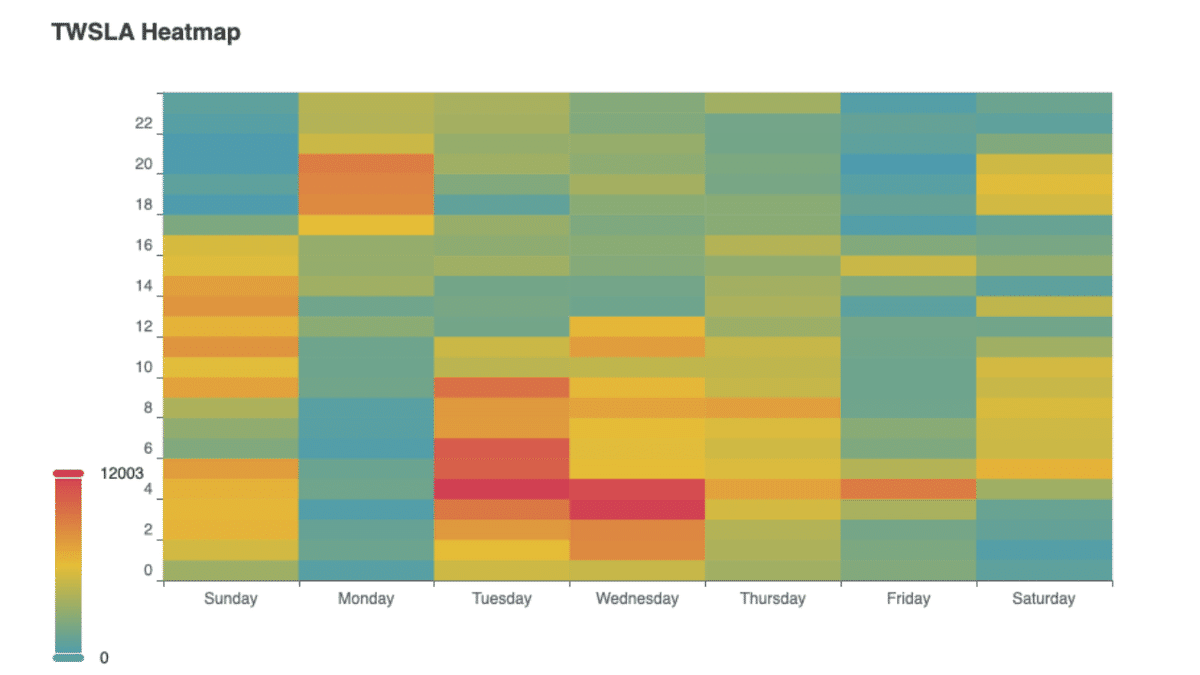
heatmap command
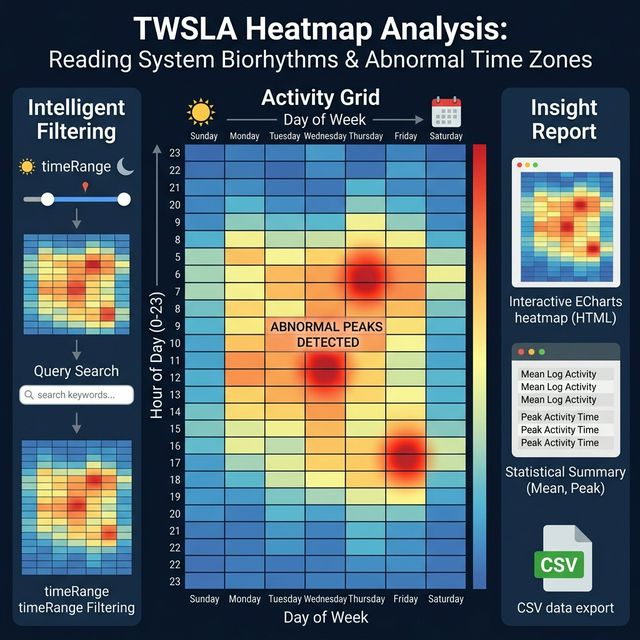
Displays log frequency over time or date using a heat map.
twsla help heatmap
Command to tally log counts by day of the week and time of day
	Aggregate by date mode is also available.

Usage:
  twsla heatmap [flags]

Flags:
  -h, --help   help for heatmap
  -w, --week   Week mode

Global Flags:
      --config string      config file (default is $HOME/.twsla.yaml)
  -d, --datastore string   Log DataStore path (.db, .badger, .parquet) (default "./twsla.db")
  -f, --filter string      Simple filter
  -v, --not string         Invert regexp filter
  -r, --regex string       Regexp filter
  -t, --timeRange string   Time range
Use -w for weekly aggregation; otherwise, it aggregates by date.
Date-based heat map:
Saved as HTML:
Weekly heat map:
time command
Analyzes time differences between logs (added in v1.6.0).
Time analysis

Usage:
  twsla time [flags]

Flags:
  -h, --help   help for time

Global Flags:
      --config string      config file (default is $HOME/.twsla.yaml)
  -d, --datastore string   Log DataStore path (.db, .badger, .parquet) (default "./twsla.db")
  -f, --filter string      Simple filter
  -v, --not string         Invert regexp filter
  -r, --regex string       Regexp filter
  -t, --timeRange string   Time range
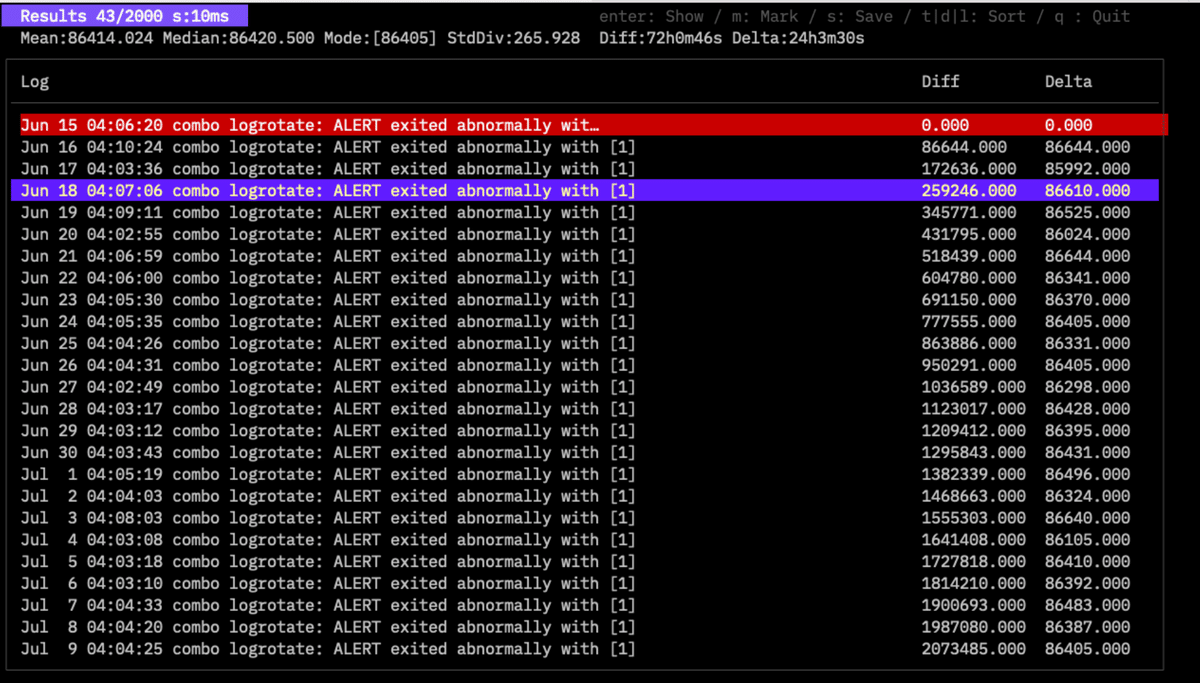
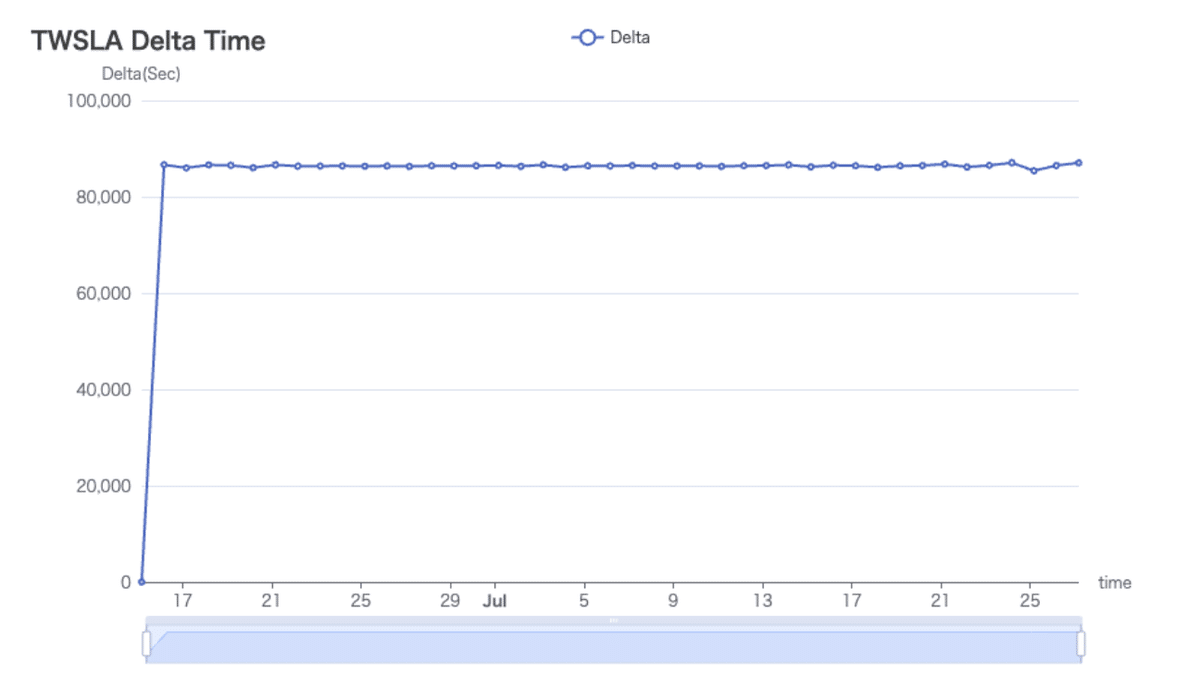
Diff shows the difference from the marked log. Delta shows the difference from the previous log. Selecting a log displays detailed statistics (Mean, Median, Mode, StdDev). Use M to mark a log. Graphs of Delta can be saved as HTML or PNG.
sigma command
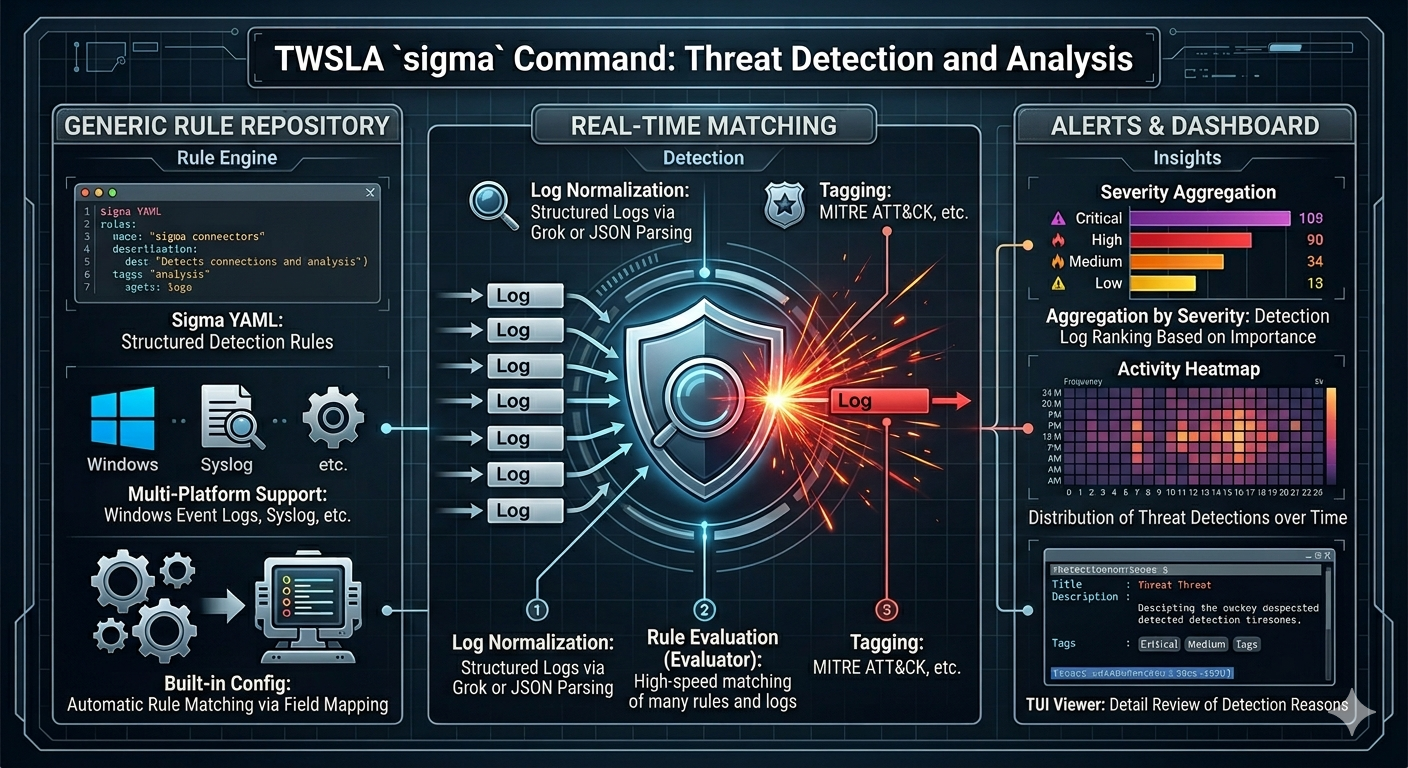
Detects threats using the standard SIGMA format (https://sigmahq.io/).
Detect threats using SIGMA rules.
	About SIGMA
	https://sigmahq.io/

Usage:
  twsla sigma [flags]

Flags:
  -c, --config string        config path
  -g, --grok string          grok definitions
  -x, --grokPat string       grok pattern if empty json mode
  -h, --help                 help for sigma
  -s, --rules string         Sigma rules path
  -p, --sigmaPacks string    Comma-separated list of built-in rule packs
      --strict               Strict rule check

Global Flags:
  -d, --datastore string   Log DataStore path (.db, .badger, .parquet) (default "./twsla.db")
  -f, --filter string      Simple filter
  -v, --not string         Invert regexp filter
  -r, --regex string       Regexp filter
  -t, --timeRange string   Time range
twsla includes 11 built-in rule packs (75 rules in total) out of the box. You can perform high-accuracy threat detection with twsla sigma without needing external rule files. See the Detailed Sigma Rule Packs Guide for target log sources and the complete list of rules for each pack.
You can select specific rule packs using -p, --sigmaPacks (e.g., windows-essential, linux-auth, wazuh-compliance), or provide an external custom rules directory with -s (external rules with the same ID automatically override built-in rules).
Built-in Sigma configurations are provided for Windows, Linux, network appliances, and Web server access logs (windows, linux, network, web). In addition, timestamp-based sliding-window correlation detection (e.g., multiple authentication failures within a short time window) is automatically evaluated based on log event timestamps.
Logs in JSON format, Syslog, Splunk-style key=val format, named regular expression captures (SSHD/Sudo/PAM decoders are automatically applied when wazuh-linux is enabled), and GROK patterns are supported.
For built-in GROK pattern definitions, see:
https://github.com/elastic/go-grok
When running the sigma command:
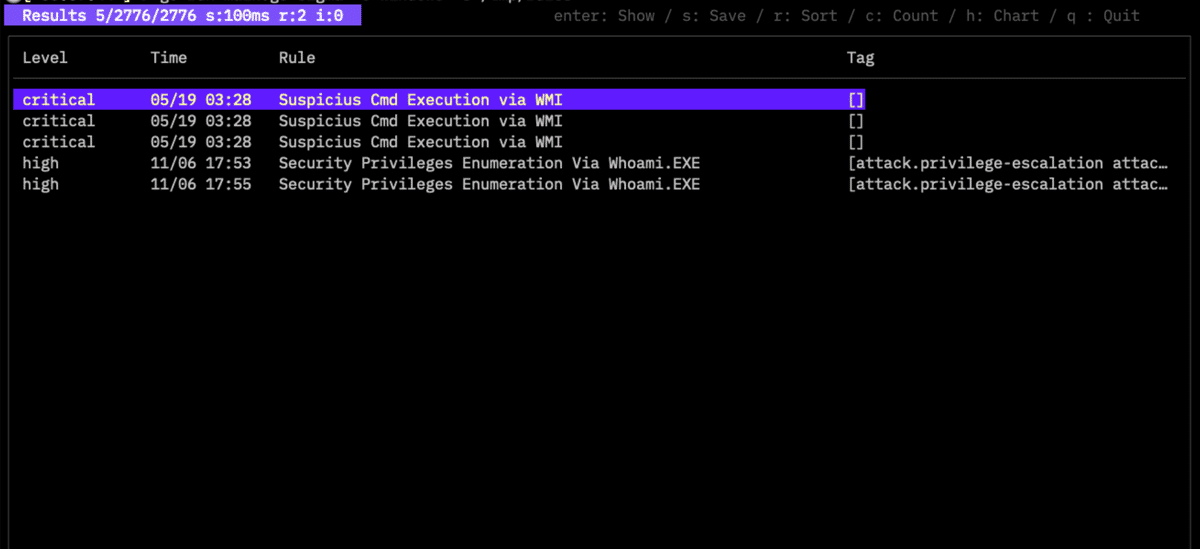
Detected rules and threat events are displayed with severity, timestamp, rule name, and global tags (MITRE ATT&CK techniques, PCI-DSS, etc.). Press Enter to view detailed logs and raw payloads.
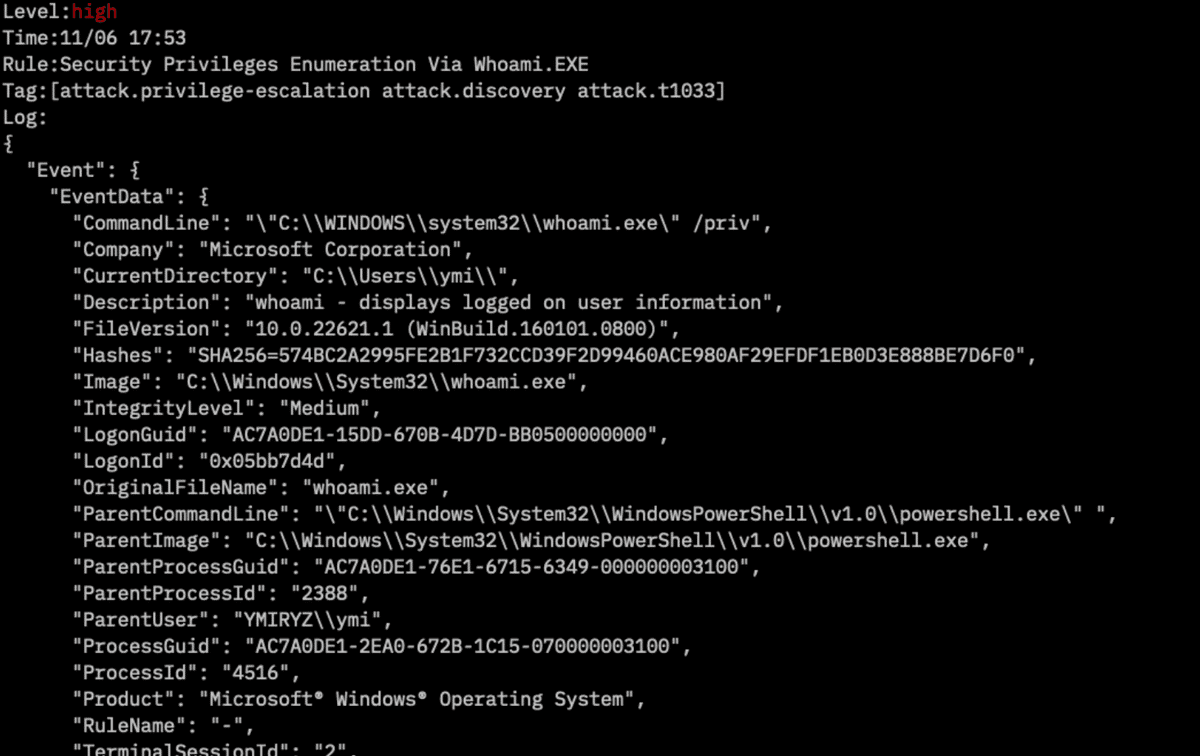
Press the c key to cycle between Event List ⇄ Rule Aggregation ⇄ Tag Aggregation (MITRE ATT&CK & Compliance).
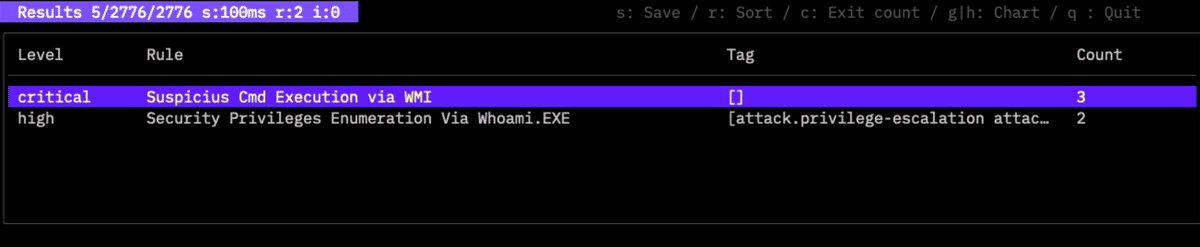
Press g or h to display aggregated bar charts (browser HTML or Sixel / PNG terminal graphics) for the current view mode (by Rule or by Tag).
Press s to save the data or charts to a file.
CLI Subactions & Wazuh Conversion Commands
# List available built-in packs
twsla sigma packs

# Display rule statistics, log sources, and top tags (MITRE / Compliance)
twsla sigma stat

# List active rules in a pack
twsla sigma list -p linux-auth

# Test rule matching against a single log line
twsla sigma test '{"content":"Failed password for invalid user admin from 192.168.1.100 port 45678 ssh2"}'

# Convert Wazuh rule XML files to Sigma YAML rules
twsla sigma convert-wazuh -o ./converted-rules ./ruleset/rules/0095-sshd_rules.xml

# Convert Wazuh decoder XML files to named regex capture patterns
twsla sigma convert-wazuh-decoder -o ./captures ./0310-ssh_decoders.xml
twlogeye command
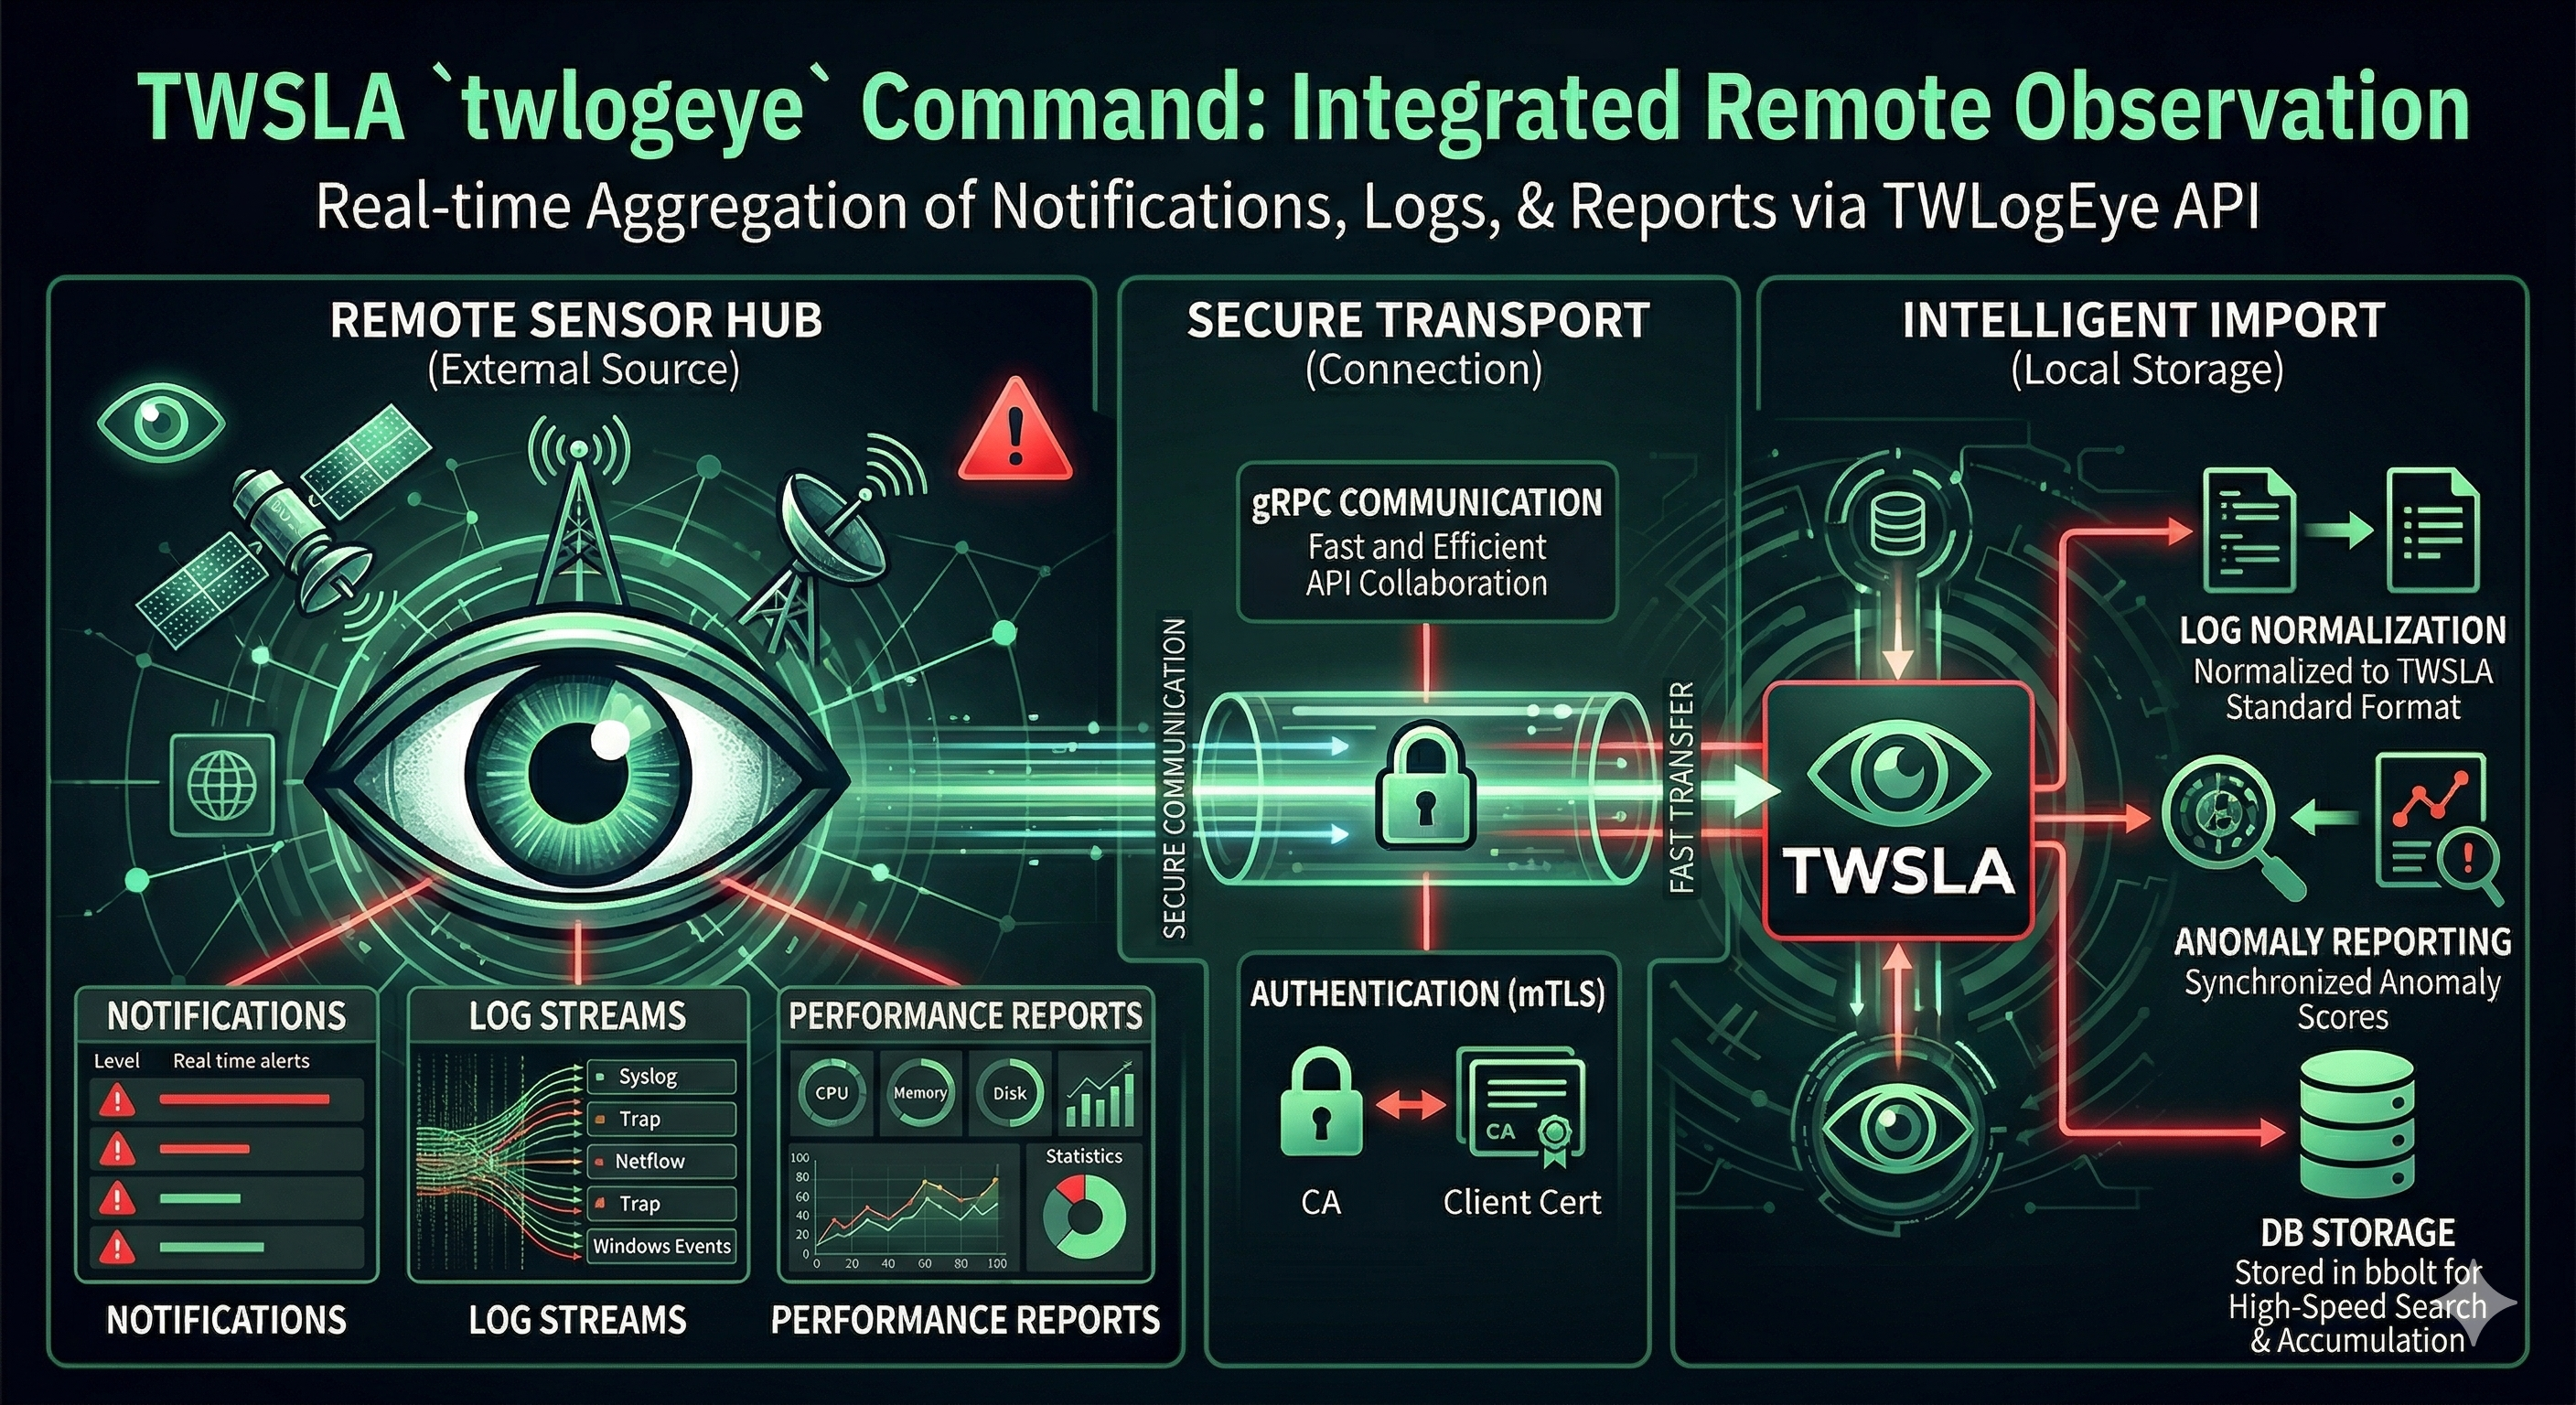
Imports notifications, logs, and reports from TwLogEye.
https://twsnmp.github.io/twlogeye/ https://github.com/twsnmp/twlogeye
Import notify, logs and reports from TwLogEye
twsla twlogeye <target> [<sub target>] [<anomaly report type>]
  target: notify | logs | report
	logs sub target: syslog | trap | netflow | winevent | otel | mqtt
	report sub target: syslog | trap | netflow | winevent | otel | mqtt | monitor | anomaly
	anomaly report type: syslog | trap | netflow | winevent | otel | mqtt | monitor | anomaly

Usage:
  twsla twlogeye [flags]

Flags:
      --anomaly string     Anomaly report type (default "monitor")
      --apiPort int        twlogeye api port number (default 8081)
      --apiServer string   twlogeye api server IP address
      --ca string          CA Cert file path
      --cert string        Client cert file path
      --filter string      Log search text
  -h, --help               help for twlogeye
      --key string         Client key file path
      --level string       Notify level

Global Flags:
      --config string      config file (default is $HOME/.twsla.yaml)
  -d, --datastore string   Log DataStore path (.db, .badger, .parquet) (default "./twsla.db")
  -v, --not string         Invert regexp filter
  -r, --regex string       Regexp filter
      --sixel              show chart by sixel
  -t, --timeRange string   Time range
ai command

Analyzes logs using LLM (significant updates in v1.17.0).
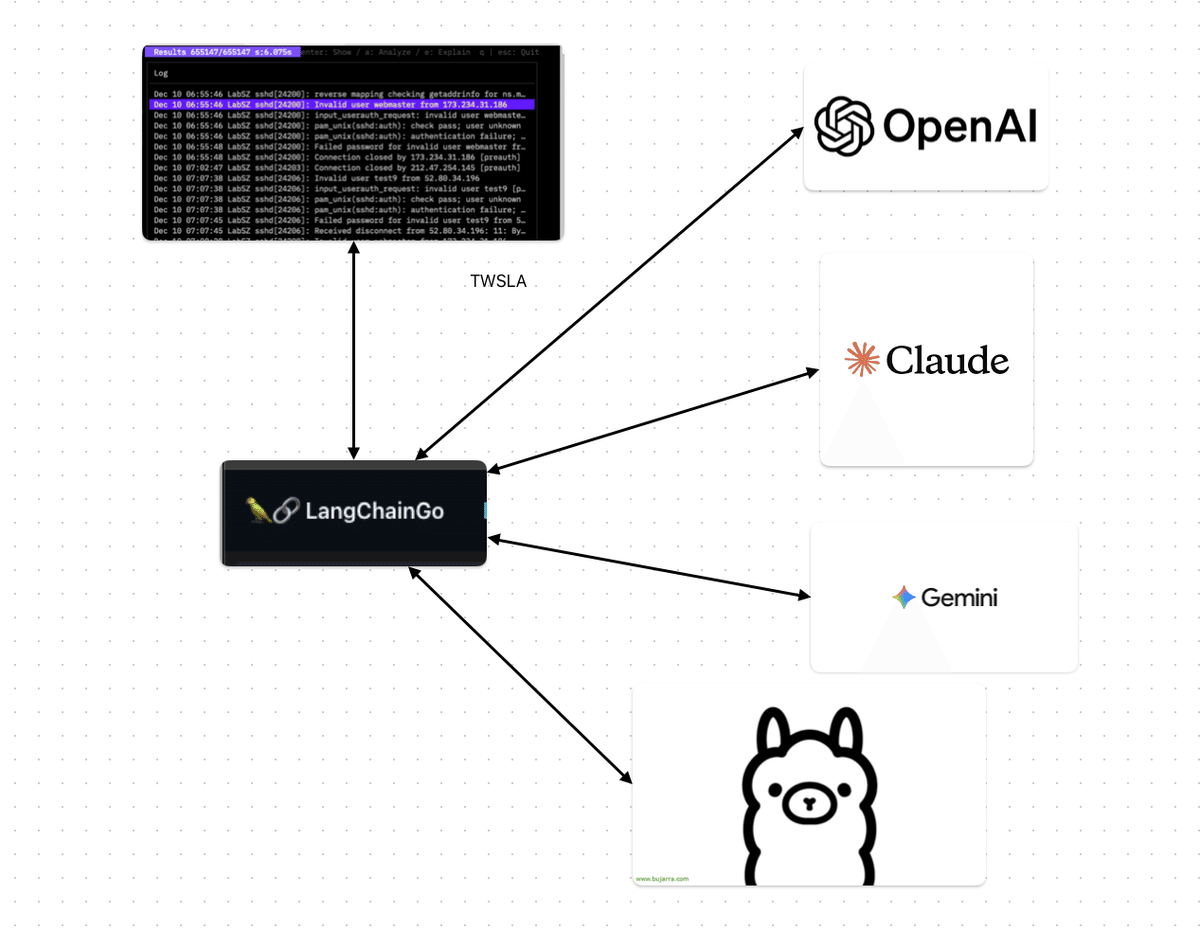
AI-powered log analysis
Using environment variables for API keys:
 GOOGLE_API_KEY : gemini
 ANTHROPIC_API_KEY : claude
 OPENAI_API_KEY : openai

Usage:
  twsla ai <filter>... [flags]

Flags:
      --aiBaseURL string       AI base URL
      --aiErrorLevels string   Words included in the error level log (default "error,fatal,fail,crit,alert")
      --aiLang string          Language of the response
      --aiModel string         LLM Model name or preset (e.g. qwen2.5-0.5b, smollm2-135m)
      --aiProvider string      AI provider(tensai|embedded|ollama|gemini|openai|claude)
      --aiSampleSize int       Number of sample logs to be analyzed by AI (default 50)
      --aiTopNError int        Number of error log patterns to be analyzed by AI (default 10)
      --aiWarnLevels string    Words included in the warning level log (default "warn")
      --aiNoMask               Do not mask PII in logs
      --noGPU                  Disable GPU acceleration and use CPU/SIMD only
  -h, --help                   help for ai

Global Flags:
      --config string      config file (default is $HOME/.twsla.yaml)
  -d, --datastore string   Log DataStore path (.db, .badger, .parquet) (default "./twsla.db")
  -f, --filter string      Simple filter
  -v, --not string         Invert regexp filter
  -r, --regex string       Regexp filter
      --sixel              show chart by sixel
  -t, --timeRange string   Time range
Specify provider, model, and filters. Environment variables are used for API keys. Ollama requires no key. Use --noGPU to disable GPU acceleration and force CPU/SIMD mode (useful for benchmark comparisons or power saving).
Starting with v1.21.0, PII (Personally Identifiable Information) such as IP addresses, email addresses, and phone numbers are automatically masked before being sent to the AI for analysis. Use the --aiNoMask flag if you want to send the original logs without masking.
Example:
$twsla ai --aiProvider ollama --aiModel qwen3:latest <Filter>
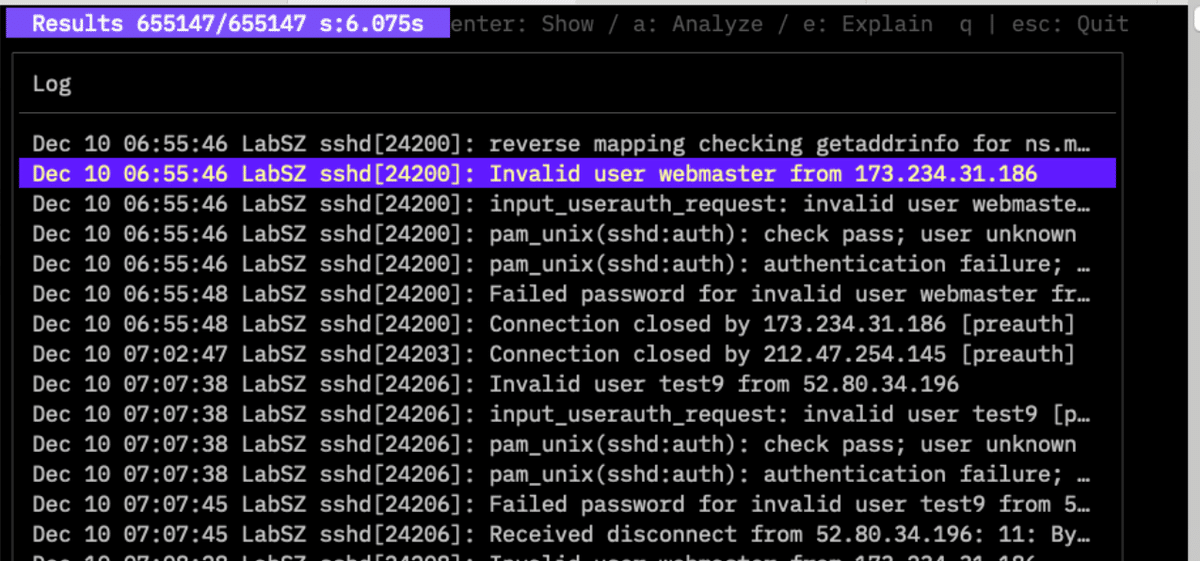
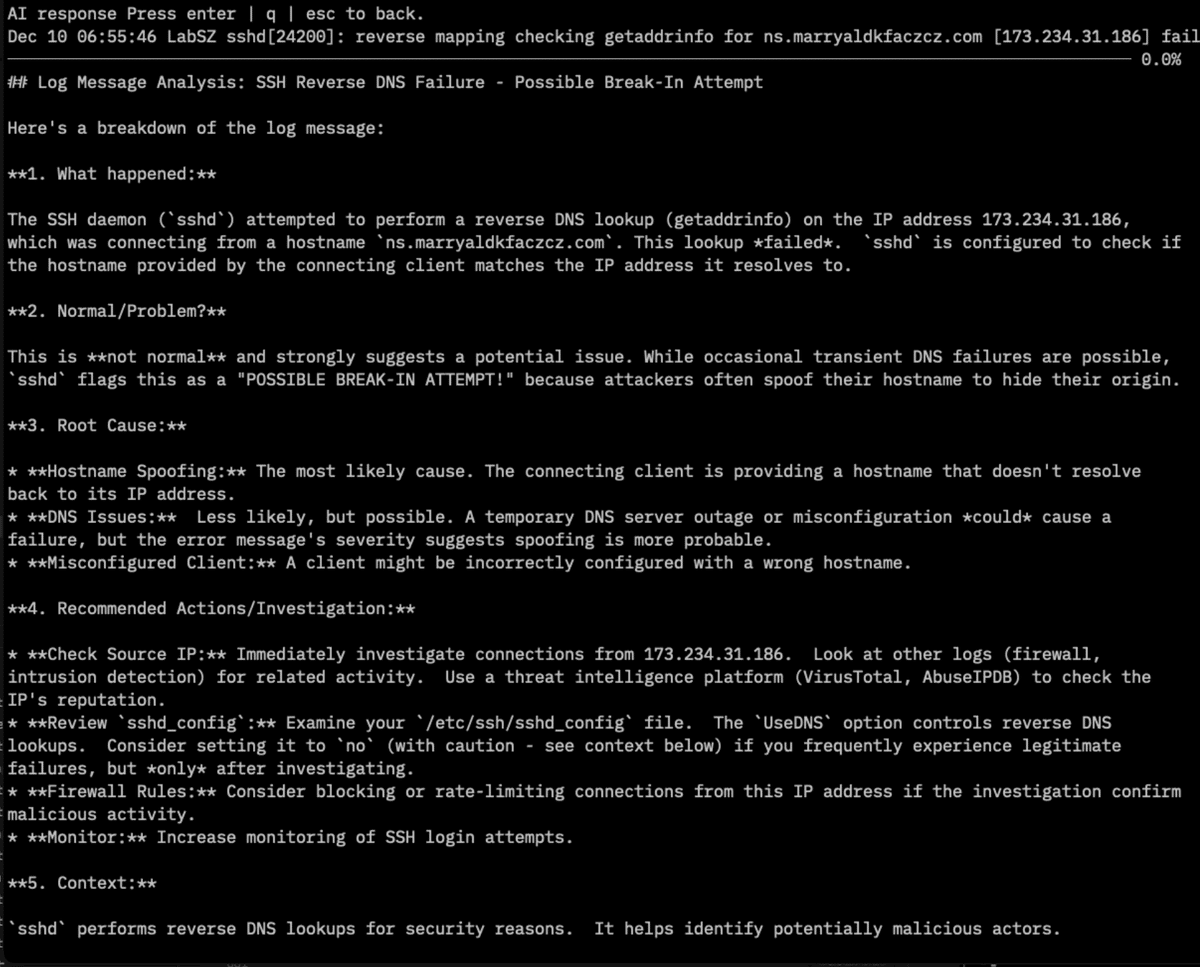
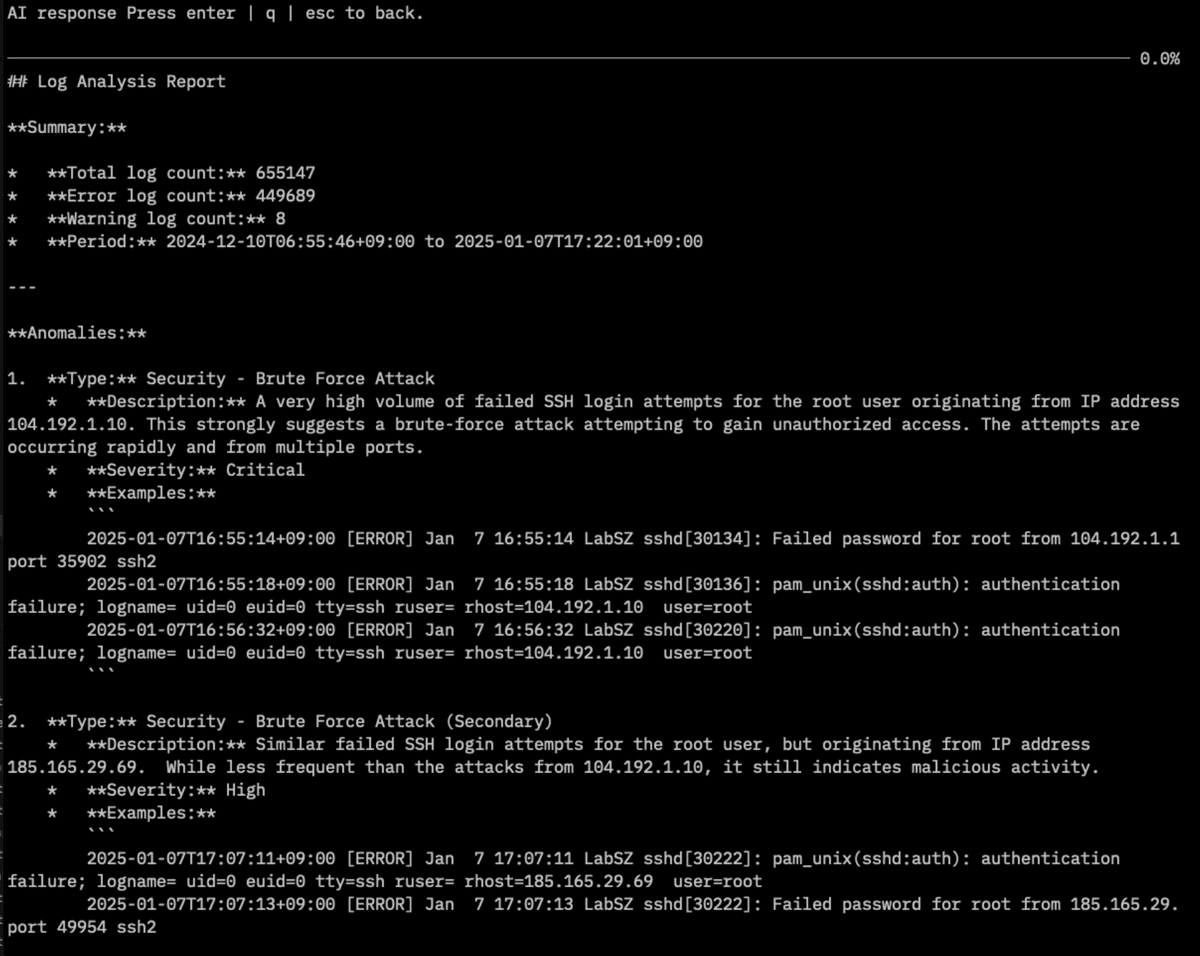
Select a log and press e for an AI explanation, or a for a summary of all searched logs.
model command
Manage local LLM models for embedded AI analysis (via tensai). Download, list, and remove models stored locally.
$ twsla help model
Manage local LLM models for embedded AI analysis.
Download, list, and remove models stored locally.

Usage:
  twsla model [command]

Available Commands:
  download      Download a model from Hugging Face or URL
  download-gpu  Download and install wgpu-native library for GPU acceleration
  list          List locally downloaded models (alias: ls)
  presets       List available preset models
  remove        Remove a local model (alias: rm)
  status        Show model directory and hardware acceleration status

Flags:
  -h, --help              help for model
      --libDir string     Directory to store native libraries (default "$HOME/.twsla/lib")
      --modelDir string   Directory to store models (default "$HOME/.twsla/models")
Managing Models and GPU Acceleration
Check status, download GPU acceleration library, or download preset models for embedded inference:
# Check active hardware acceleration status (GPU / SIMD / CPU)
$ twsla model status

# Download and install wgpu-native library for GPU (Metal/Vulkan/D3D12) acceleration
$ twsla model download-gpu

# View available preset models
$ twsla model presets

# Download a preset model (e.g. qwen2.5-coder-0.5b)
$ twsla model download qwen2.5-coder-0.5b

# List downloaded models (short alias: ls)
$ twsla model list
$ twsla model ls

# Remove a model (short alias: rm, preset name supported)
$ twsla model rm qwen2.5-coder-0.5b
Available Preset Models:
| Preset Name | Model | Approx Size | Features / Recommended Use |
|---|---|---|---|
qwen2.5-0.5b |
Qwen2.5-0.5B-Instruct (Q8_0) | ~500MB | Default ultra-lightweight general model |
qwen2.5-1.5b |
Qwen2.5-1.5B-Instruct (Q4_K_M) | ~1.0GB | High quality lightweight general model |
qwen2.5-coder-0.5b |
Qwen2.5-Coder-0.5B-Instruct (Q8_0) | ~500MB | Specialized for logs, JSON & code analysis |
qwen2.5-coder-1.5b |
Qwen2.5-Coder-1.5B-Instruct (Q4_K_M) | ~1.0GB | High-accuracy structured log & code analysis |
smollm2-135m |
SmolLM2-135M-Instruct (Q8_0) | ~145MB | Ultra-fast & minimal footprint (IoT / low resources) |
smollm2-360m |
SmolLM2-360M-Instruct (Q8_0) | ~380MB | Balanced compact model |
smollm2-1.7b |
SmolLM2-1.7B-Instruct (Q4_K_M) | ~1.1GB | SmolLM2 top-tier reasoning model |
deepseek-r1-1.5b |
DeepSeek-R1-Distill-Qwen-1.5B (Q4_K_M) | ~1.1GB | Reasoning model with <think> step-by-step thinking |
llama-3.2-1b |
Llama-3.2-1B-Instruct (Q4_K_M) | ~800MB | Meta Llama 3.2 1B model |
tinyllama |
TinyLlama-1.1B-Chat-v1.0 (Q4_K_M) | ~670MB | Classic lightweight model |
mcp command
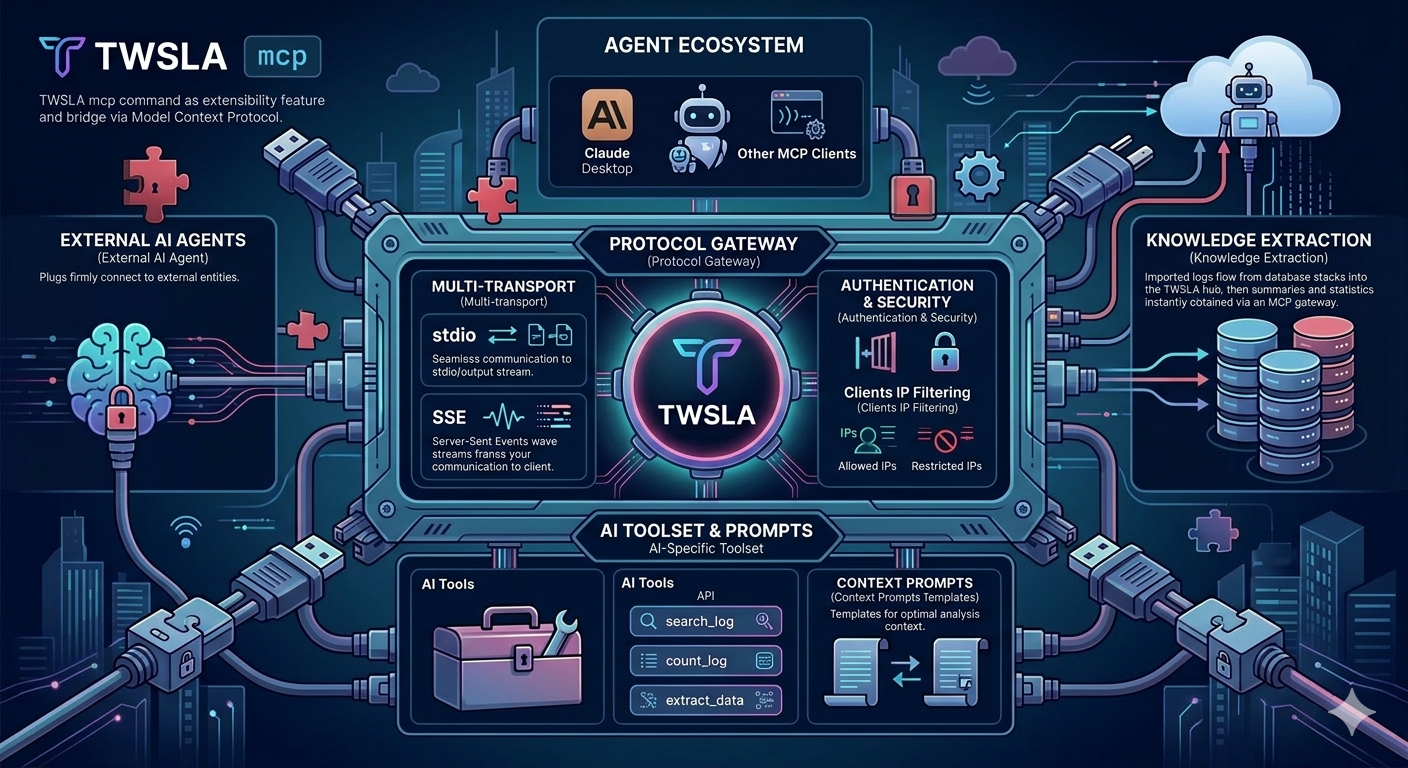
MCP (Model Context Protocol) server for AI agents.
$twsla help mcp
MCP server for AI agent

Usage:
  twsla mcp [flags]

Flags:
      --clients string     IP address of MCP client to be allowed to connect (comma-separated)
      --endpoint string    MCP server endpoint (default "127.0.0.1:8085")
      --geoip string       geo IP database file
  -h, --help               help for mcp
      --transport string   MCP server transport(stdio/sse/stream) (default "stdio")

Global Flags:
      --config string      config file (default is $HOME/.twsla.yaml)
  -d, --datastore string   Log DataStore path (.db, .badger, .parquet) (default "./twsla.db")
  -f, --filter string      Simple filter
  -v, --not string         Invert regexp filter
  -r, --regex string       Regexp filter
      --sixel              show chart by sixel
  -t, --timeRange string   Time range
System Prompt for MCP Server Tools
# TWSLA Log Analysis AI - System Prompt

You are an AI assistant for TWSLA (TWSNMP Log Analyzer). Your primary role is to help users analyze logs stored in the TWSLA database. You can search, count, extract data, detect anomalies and threats, and summarize logs.

## Available Tools

To interact with the TWSLA log database, you have access to the following tools:

### 1. `search_log`

Use this tool to search for log entries matching specific criteria.

**Parameters:**

*   `filter` (string, optional): Regular expression to filter logs. If empty, no filter is applied.
*   `limit` (integer, optional): Maximum number of log entries to return. (Min: 100, Max: 10000, Default: 100)
*   `start` (string, optional): Start date and time for the search (e.g., "2025/10/26 11:00:00"). If empty, starts from the beginning.
*   `end` (string, optional): End date and time for the search (e.g., "2025/10/26 12:00:00"). If empty, defaults to current time.

**Example:**
To search for logs containing "error" in the last hour:
`search_log(filter="error", start="-1h")`

### 2. `count_log`

Use this tool to count log entries grouped by a specific unit. This is useful for statistical analysis.

**Parameters:**

*   `filter` (string, optional): Regular expression to filter logs before counting.
*   `unit` (string, optional): Unit of counting. (Default: "time")
    *   `time`: Group by time intervals.
    *   `ip`: Group by source IP address.
    *   `email`: Group by email address.
    *   `mac`: Group by MAC address.
    *   `host`: Group by hostname (requires DNS resolution).
    *   `domain`: Group by domain name.
    *   `country`: Group by country (requires GeoIP database).
    *   `loc`: Group by geographic location (requires GeoIP database).
    *   `word`: Group by individual words in the log message.
    *   `field`: Group by a specific field (space-separated).
    *   `normalize`: Group by normalized log patterns.
*   `unit_pos` (integer, optional): Position of the unit if `unit` is "field". (Default: 1)
*   `top_n` (integer, optional): Number of top results to return. (Default: 10)
*   `interval` (integer, optional): Aggregation interval in seconds if `unit` is "time". (Default: auto)
*   `start` (string, optional): Start time for the search.
*   `end` (string, optional): End time for the search.

**Example:**
To count the top 10 source IP addresses in the last 24 hours:
`count_log(unit="ip", top_n=10, start="-24h")`

### 3. `extract_data_from_log`

Use this tool to extract specific information (IP addresses, email addresses, custom patterns, etc.) from log entries.

**Parameters:**

*   `filter` (string, optional): Regular expression to filter logs before extraction.
*   `pattern` (string, required): Pattern of data to extract.
    *   `ip`, `mac`, `email`, `number`
    *   Or a custom regular expression.
*   `pos` (integer, optional): Position of data to extract if multiple matches are found. (Default: 1)
*   `start` (string, optional): Start time for the search.
*   `end` (string, optional): End time for the search.

**Example:**
To extract all IP addresses from logs containing "failed login" in the last day:
`extract_data_from_log(filter="failed login", pattern="ip", start="-1d")`

### 4. `import_log`

Use this tool to import new logs into the TWSLA database from a file or directory.

**Parameters:**

*   `path` (string, required): Path to the log file or directory. Can handle compressed files like `.zip`, `.tar.gz`, `.gz`.
*   `pattern` (string, optional): Regular expression to filter filenames within a directory or archive.

**Example:**
To import all `.log` files from the `/var/log/` directory:
`import_log(path="/var/log/", pattern=".*\.log")`

### 5. `get_log_summary`

Use this tool to get an overview of logs for a specified period. The summary includes total entries, error and warning counts, and top error patterns.

**Parameters:**

*   `filter` (string, optional): Regular expression to filter logs.
*   `top_n` (integer, optional): Number of top error patterns to return. (Default: 10)
*   `start` (string, optional): Start time for the summary.
*   `end` (string, optional): End time for the summary.

**Example:**
To get a summary of all logs from yesterday:
`get_log_summary(start="-1d", end="today")`

### 6. `detect_threats_sigma`

Detect security threats in logs using SIGMA rules. Supports custom rule paths or embedded configuration mappings.

**Parameters:**

*   `rules` (string, optional): Path to SIGMA rules directory or YAML file.
*   `config` (string, optional): Embedded SIGMA config name (e.g. "windows").
*   `strict` (boolean, optional): Enable strict rule parsing (default: false).

### 7. `detect_anomalies`

Detect anomaly logs using machine learning and statistical algorithms (Isolation Forest, Autoencoder, LSTM, LOF, k-NN, Mahalanobis, Z-Score).

**Parameters:**

*   `mode` (string, optional): Detection mode (`tfidf`, `sql`, `os`, `dir`, `walu`, `number`, default: `tfidf`).
*   `algo` (string, optional): Anomaly algorithm (`iforest`, `autoencoder`, `lstm`, `lof`, `knn`, `mahalanobis`, `zscore`, default: `iforest`).
*   `filter` (string, optional): Target log filter regex.
*   `extract` (string, optional): Numeric extraction pattern.
*   `top_n` (integer, optional): Top N outlier logs to return (default: 10).

### 8. `analyze_relations`

Analyze relationships and co-occurrences between multiple data elements (IP, MAC, Email, URL, Regex patterns).

**Parameters:**

*   `data` (array of string, required): Array of data patterns (e.g. `["ip", "mac"]`, `["ip", "regex/failed/red"]`).
*   `filter` (string, optional): Log filter regex.
*   `top_n` (integer, optional): Top N relations to return (default: 10).

### 9. `analyze_tfidf`

Discover rare or outlier logs based on TF-IDF similarity thresholds.

**Parameters:**

*   `filter` (string, optional): Log filter regex.
*   `limit` (number, optional): Similarity threshold (default: 0.5).
*   `count` (integer, optional): Threshold crossing limit.
*   `top_n` (integer, optional): Top N rare logs (default: 10).

## Available Resources

*   `twsla://db/status`: Provides datastore type, total record count, and timestamp range of logs in JSON.
*   `twsla://sigma/rules`: Provides list of embedded Sigma configuration mappings.

## Available Prompts

*   `incident_investigation`: End-to-end incident investigation workflow across timeline, anomalies, and correlations.
*   `security_threat_hunt`: Threat hunting workflow using SIGMA detection and Web attack anomaly detection.
*   `anomaly_audit`: System audit workflow for outliers and rare patterns.

## General Instructions

*   Always analyze the user's request carefully to choose the most appropriate tool.
*   When dealing with time, you can use relative periods (e.g., "-1h", "-24h") or absolute timestamps.
*   Combine tools to answer complex questions. For example, use `get_db_info` or `search_log` first to get an overview of data, then use `count_log`, `detect_anomalies`, or `analyze_relations` for detailed analysis.
*   If the user's request is ambiguous, ask for clarification before running any tools.
MCP Server Configuration
- Transport:
stdio(console),sse(server-sent events), orstream(HTTP with client filtering). - Endpoint: Default
127.0.0.1:8085. - Clients: Whitelist of IP addresses specified as comma-separated values.
update command
Update twsla to the latest or specified version from GitHub releases.
$ twsla help update
Update twsla to the latest or specified version from GitHub releases.

Usage:
  twsla update [flags]

Flags:
  -c, --check            Check for updates only
  -h, --help             help for update
      --version string   Update to specified version
  -y, --yes              Update without confirmation

Global Flags:
      --config string      config file (default is $HOME/.twsla.yaml)
  -d, --datastore string   Log DataStore path (.db, .badger, .parquet) (default "./twsla.db")
  -f, --filter string      Simple filter
  -v, --not string         Invert regexp filter
  -r, --regex string       Regexp filter
      --sixel              show chart by sixel
  -t, --timeRange string   Time range
completion command
Generates shell autocompletion scripts for bash, fish, powershell, and zsh.
Bash (Linux):
$ twsla completion bash | sudo tee /etc/bash_completion.d/twsla
Zsh (macOS):
$ mkdir -p ~/.zsh/completion/
$ twsla completion zsh > ~/.zsh/completion/_twsla
Add to ~/.zshrc:
fpath=(~/.zsh/completion $fpath)
autoload -Uz compinit && compinit -i
PowerShell (Windows):
> twsla completion powershell | Out-String | Invoke-Expression
version command
Displays the twsla version.
$ twsla version
twsla v2.2.0(commit) 2026-09-10T00:00:00Z
Basic explanation
Supported logs
- Text files with timestamps per line (including multiline logs)
- Windows EVTX format
- TWSNMP’s internal logs
- Email files (
.eml) - Mail on IMAP/POP3 servers
- Grafana Loki (
loki://,lokis://) - Elasticsearch (
es://) / OpenSearch (opensearch://) - twlogeye (
twlogeye://)
Supports ZIP, Tar.gz, and GZ compression. Timestamps are automatically detected. SCP/SSH and TWSNMP FC imports are also supported.
Supports multiple datastore formats: bbolt (.db), BadgerDB (.badger), and Parquet (.parquet).
Simple filter
A beginner-friendly alternative to regular expressions. Supports * and ? wildcards. For example, Message* becomes Message.* internally. From v1.15.0, keywords are supported:
| Keyword | Description |
|---|---|
| #IP | Contains IP address |
| #IPV6 | Contains IPv6 address |
| #MAC | Contains MAC address |
| #LOCAL_IP | Contains local IP address |
| Contains email address | |
| #URL | Contains URL |
| #CREDITCARD | Contains Credit Card number |
| #MYNUMBER | Contains My Number (Japan) |
| #PHONE_JP | Contains Japanese phone number |
| #PHONE_US | Contains US phone number |
| #PHONE_INTL | Contains international phone number |
| #ZIP_JP | Contains Japanese zip code |
| #UUID | Contains UUID |
Exclusion filter
Exclude lines using the same logic as grep -v.
Time range
Flexible input formats:
2024/01/01T00:00:00+0900-2024/01/02T00:00:00+09002024/1/1,1d(Start, duration)
Data extraction patterns
Supported keys for -e: IP, IPV6, MAC, Number, Email, CREDITCARD, MYNUMBER, PHONE_JP, PHONE_US, PHONE_INTL, ZIP_JP, UUID, LOC, Country, HOST, Domain. Use -p to specify which occurrence to extract. Custom patterns like count=%{number} are also supported.
GROK and JSON modes
Advanced extraction since v1.7.0.
- GROK: Use
-e grok -x <pattern>. - JSON: Use
-e json -n <jsonpath>.
Graphs
Save graphs as PNG or view interactive HTML versions. Graphs can also be displayed in the terminal using Sixel (--sixel).
IP Information (DNS/GeoIP)
Enrich logs with GeoIP and DNS information. Requires a GeoLite2 database for loc and country modes.
$ twsla count -e ip --ip country --geoip ./GeoLite2-City.mmdb "Failed password"
Configuration and environment variables
Supports ~/.twsla.yaml and environment variables like TWSLA_DATASTORE, TWSLA_GEOIP, TWSLA_GROK, and TWSLA_SIXEL.
| Key | Description |
|---|---|
| timeRange | Time range |
| filter | Simple filter |
| regex | Regular expression filter |
| not | Inverted filter |
| extract | Extraction pattern |
| name | Variable name |
| grokPat | GROK pattern |
| ip | IP Information Mode |
| color | Color Mode |
| Rules | Sigma rules path |
| sigmaconfig | Sigma settings |
| twsnmp | TWSNMP FC URL |
| interval | Aggregation intervals |
| jsonOut | JSON format output |
| checkCert | Verify server certificate |
| datastore | Datastore path |
| geoip | GeoIP DB path |
| grok | GROK definition |
| sixel | Terminal graph display |
Build
Built with go-task.
$ task
Copyright
See ./LICENSE
Copyright 2024-2026 Masayuki Yamai