Getting Started with TWSNMP NEO
Next-Generation Container-Native & Web-Based Network Management System

1. Introduction
TWSNMP NEO represents the next generation of the renowned TWSNMP network management system series. It consolidates the container portability of TWSNMP FC and the advanced visual and AI capabilities of TWSNMP FK, built from the ground up on modern web architecture (Go 1.27+, Svelte 5 with Runes, and TypeScript).
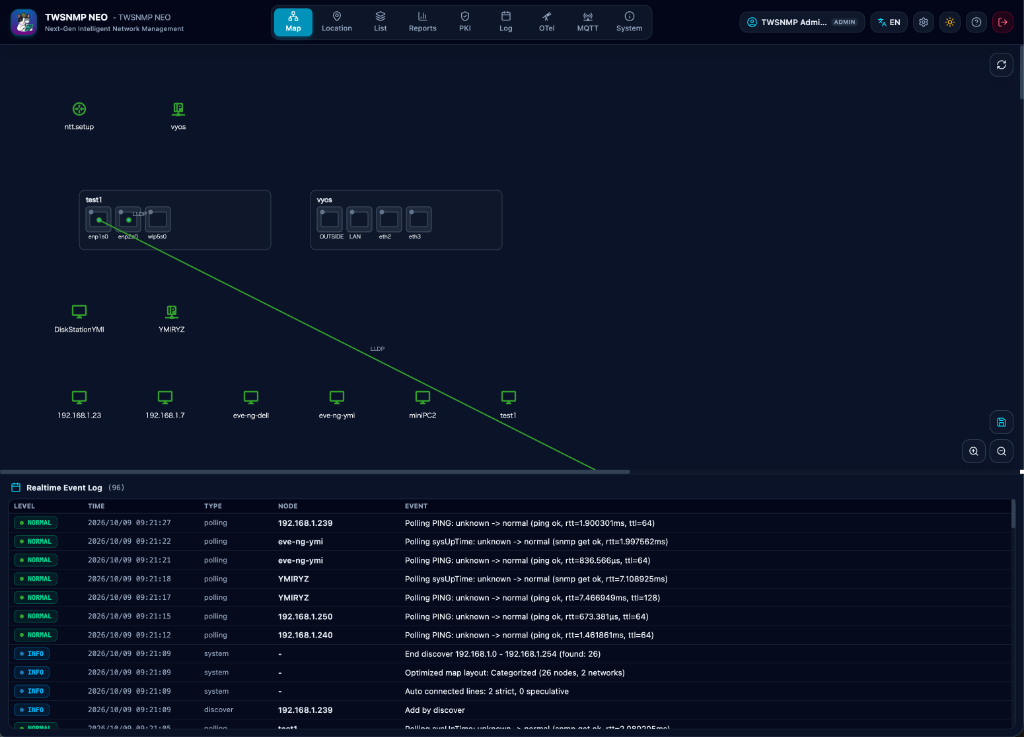
Core Highlights
- Zero-Install Web Experience: Full management capabilities accessible from any modern desktop or mobile browser.
- p5.js & 3D WebGL Canvas: Hardware-accurate switching hub panels with real-time port LEDs and full 3D interactive hardware panels (
vpanel). - GIS Geographic Map (MapLibre): Plot network nodes across geographic tile layers (OpenStreetMap, GSI, CARTO, etc.) with real-time health status coloring and interactive positioning.
- Public Dashboard & Embed System: Token-authenticated public view (
/dashboard/:key) featuring multiple item rotations, twFathom-style KPI cards, TV drama alert overlay with audio hazard alarm, and iframe embedding. - TWAgent & AI Security Telemetry (
twagentneo): Zero-config cross-platform agent ingestion, live host telemetry, Sigma rule detection with local LLM verification, File Integrity Monitoring (FIM), and CIS Benchmark Security Configuration Assessment (SCA). - Apache Parquet Columnar Storage & Fast Compaction: Millions of Syslog, TRAP, NetFlow, and sFlow records stored with high compression ratios, in-memory caching, timestamp range filtering, and automated background file compaction.
- Enterprise Database Backup & Disaster Recovery: Transaction-safe live snapshots via
bbolt.Tx.CopyFile, automated recurring schedules, generation rotation, web-based archive management, and offline CLI disaster recovery & compaction. - Native AI & Built-in MCP Server (42 Tools): Integrated multi-LLM client (
tensai) and Model Context Protocol (MCP) server for instant root cause diagnosis, topology/polling automation, NetFlow & AI anomaly inspection, OTel APM metrics/traces inspection, and natural language polling creation. - Self-Contained Private PKI: Issue, renew, and automate TLS certificates via ACME and SCEP directly within your network manager.
2. Installation & Startup
TWSNMP NEO runs either as a Docker container or as a standalone lightweight executable binary.
Running with Docker
docker run -d \
  --name twsnmpneo \
  --restart always \
  -p 8080:8080 \
  -p 514:514/udp \
  -p 162:162/udp \
  -p 2055:2055/udp \
  -p 6343:6343/udp \
  -v $(pwd)/data:/data \
  ghcr.io/twsnmp/twsnmpneo:latest
After startup, open your browser and go to http://<host-ip>:8080.
Running with Docker Compose
Create a docker-compose.yml file:
services:
  twsnmpneo:
    image: ghcr.io/twsnmp/twsnmpneo:latest
    container_name: twsnmpneo
    restart: always
    ports:
      - "8080:8080"       # Web UI & REST / MCP API
      - "514:514/udp"     # Syslog UDP
      - "162:162/udp"     # SNMP TRAP UDP
      - "2055:2055/udp"   # NetFlow / IPFIX
      - "6343:6343/udp"   # sFlow
    volumes:
      - ./data:/data
Launch with:
docker compose up -d
Homebrew (macOS / Linux)
brew install twsnmp/tap/twsnmpneo
twsnmpneo -datastore ./data -port 8080
Windows (Standalone & Background Service)
Download twsnmpneo_windows_amd64.zip from GitHub Releases and register as a native Windows service:
# Register as service (Automatic start on boot)
.\twsnmpneo.exe service install -service-auto -datastore C:\twsnmpneo\data -port 8080

# Start service
.\twsnmpneo.exe service start
Linux (curl Installer & systemd Service)
# One-liner curl install
curl -sS https://raw.githubusercontent.com/twsnmp/twsnmpneo/main/install/install.sh | sh

# Grant network capabilities
sudo setcap 'cap_net_bind_service,cap_net_raw+ep' /usr/local/bin/twsnmpneo

# Run directly
twsnmpneo -datastore ./data -port 8080

# Or register as a Linux systemd background service
sudo twsnmpneo service install -auto -datastore /var/lib/twsnmpneo -port 8080
sudo twsnmpneo service start
Smart Self-Updater
TWSNMP NEO detects its runtime environment (Docker, Homebrew, Standalone) and provides seamless self-updates:
# Check for updates
twsnmpneo update -check

# Update in-place and safely restart
twsnmpneo update -y
3. User Interface Overview
TWSNMP NEO is engineered as a responsive Single Page Application (SPA).
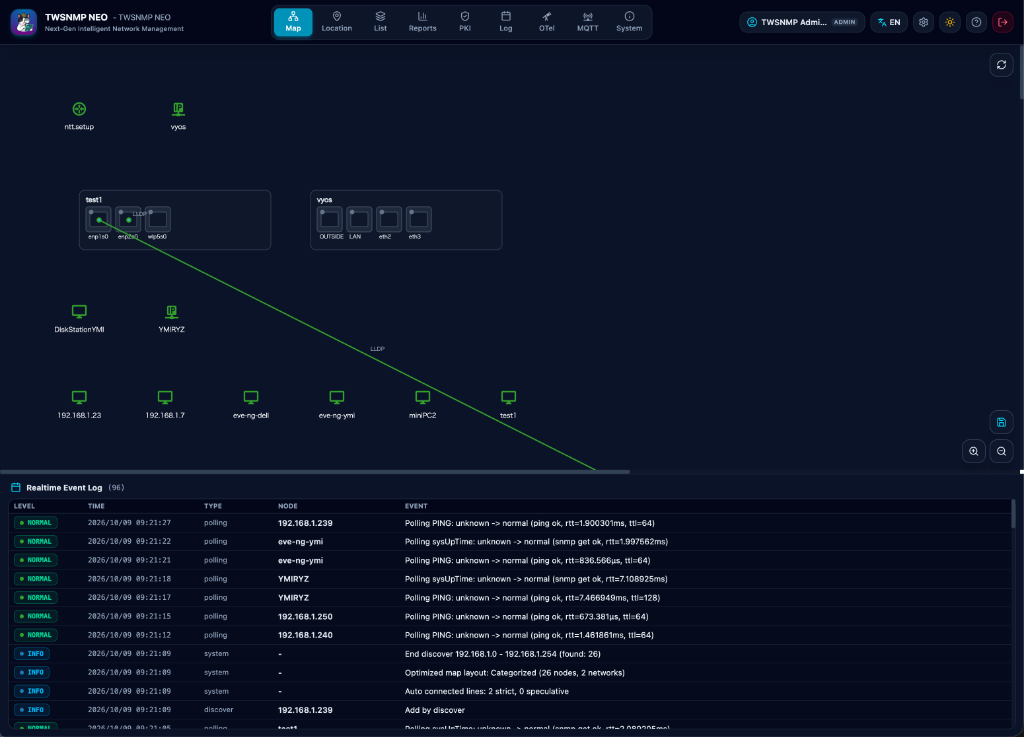
- Top Navigation Bar:
- Quick switching between Map, Reports, PKI, Logs, and Settings.
- Light / Dark Mode Toggle with immediate theme adaptation.
- Global Severity Counters (Critical, Warning, Low, Unknown).
- Main Interactive Canvas: Pan, zoom, drag-and-drop nodes, and multiselect.
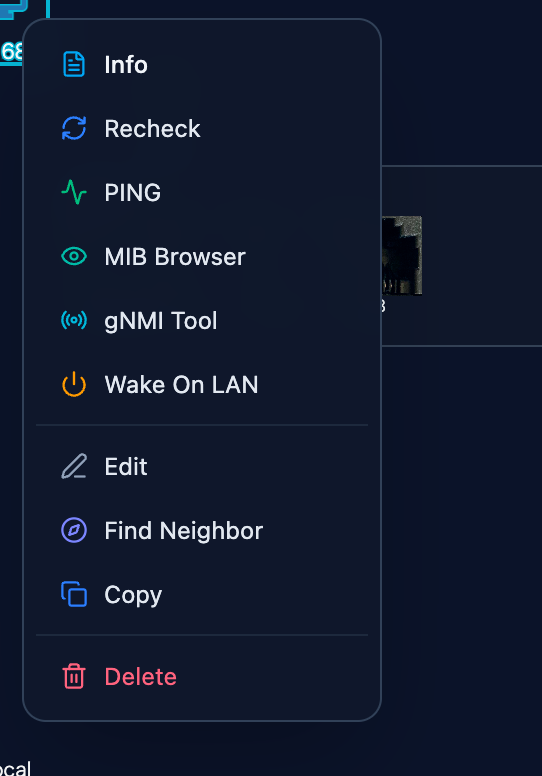
- Context Menus: Right-click nodes, network switches, lines, or draw items. Menus follow a unified action system (“Info”, “Edit”, “Delete”) and dynamically adapt options (such as showing “Wake On Lan” only when a valid MAC address is configured).
4. Map Screen
Nodes and Networks (SW-HUB Port Panel)
- Nodes: Physical servers, routers, endpoints, and appliances with status glows (Green: Normal, Yellow: Warning, Red: Critical, Gray: Inactive).
- Networks (SW-HUB Container): Visualizes physical switches with RJ45 port images, Link UP/DOWN status LEDs, port numbers, and auto-wrapping layout.
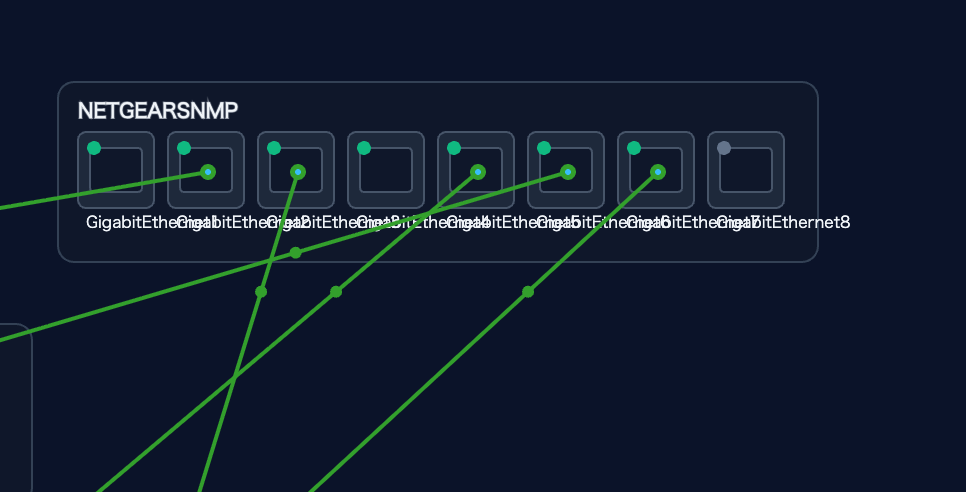
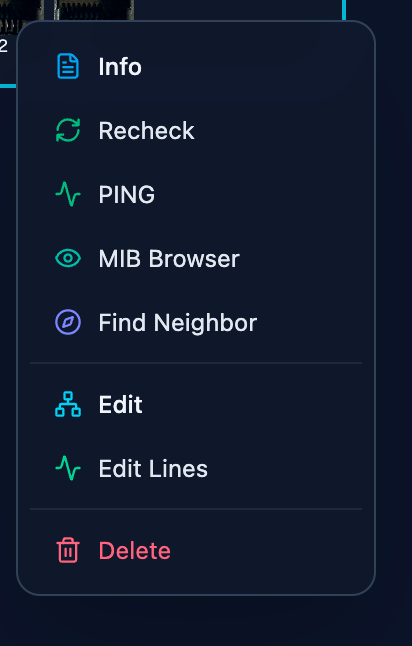
Right-clicking any network (SW-HUB) container opens a dedicated context menu providing direct access to information inspection, PING, MIB browser, neighbor topology finder, container property edits, and batch port-line editing:
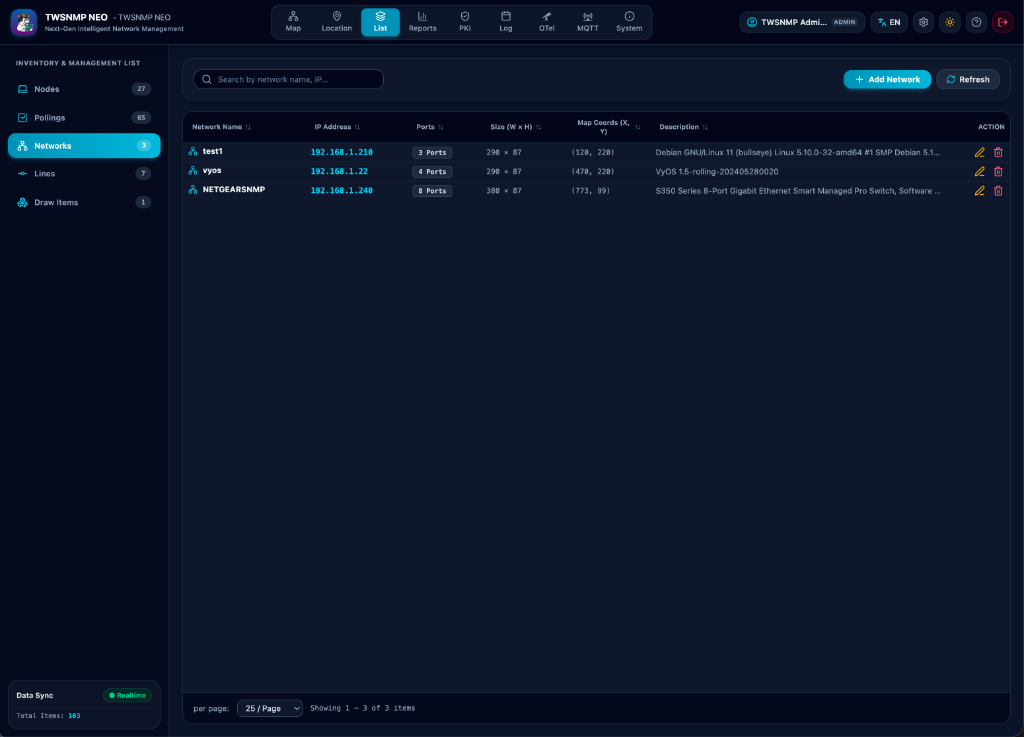
Switching hubs and networks can also be managed via the dedicated inventory list:
Connection Lines & Packet Flow Animation
Connect nodes and switch ports via drag-and-drop or Shift+click. When bound to traffic polling metrics, line widths dynamically scale with bandwidth utilization, and packet flow dots animate in real time.
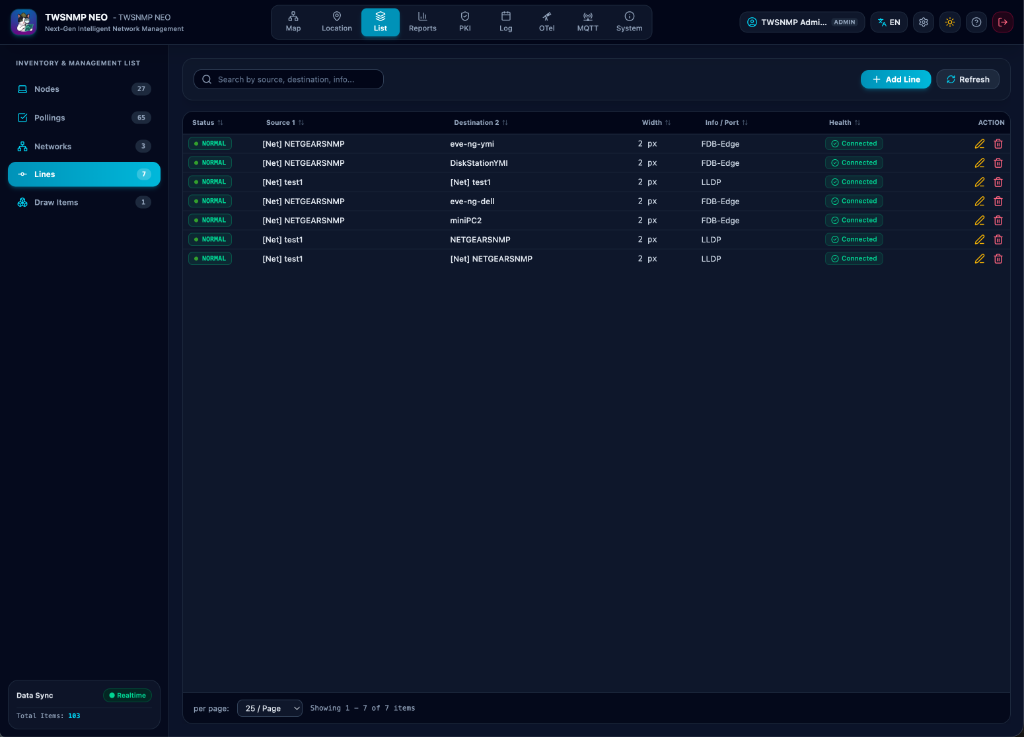
Lines can also be audited and managed in the Lines inventory table (Source, Destination, Width, Info/Port discovery reason, and Connection Health):
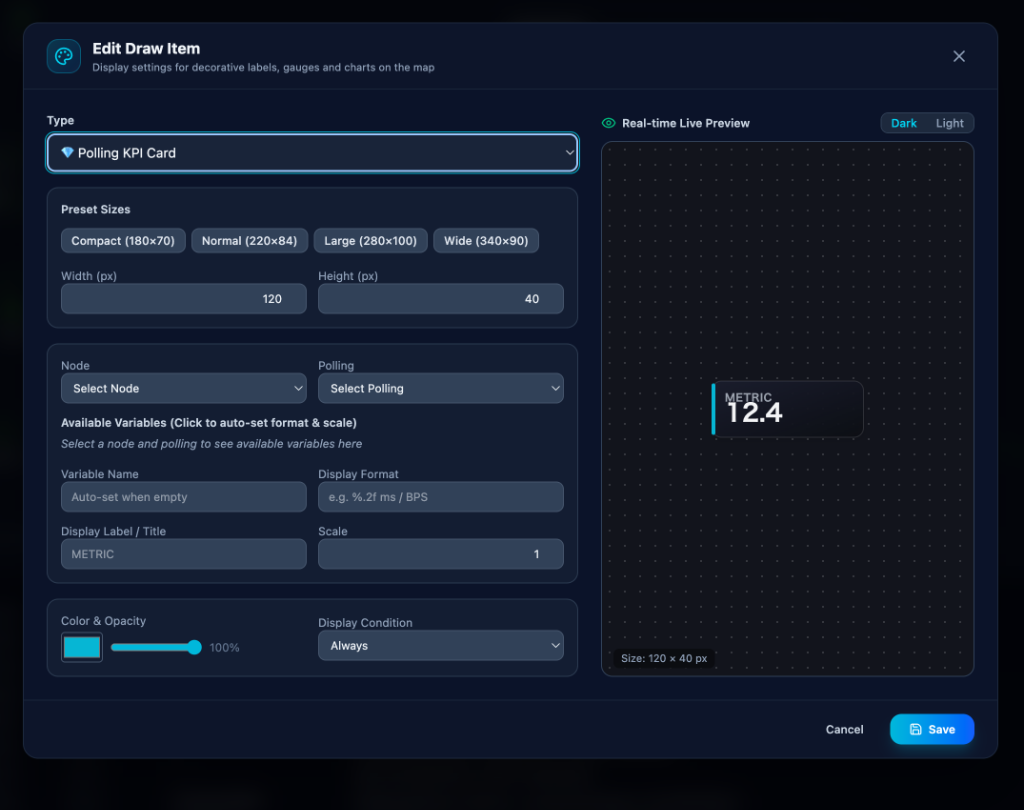
Draw Items (11 Types)
Enrich your topology map with functional and aesthetic widgets:
- Rectangles / Ellipses: Zone grouping and network perimeter boundaries
- Text / Labels: Custom headers and descriptions
- Static Images: Floor blueprints, office maps, or rack layouts
- Classic Gauge: Analog dial needle meters
- Radial Gauge: Donut charts for CPU / memory utilization
- Bar Gauge: Horizontal resource meters (storage, bandwidth)
- Sparkline: Time-series micro-charts
- Real-Time KPI Cards: High-impact numeric metric displays with color thresholding
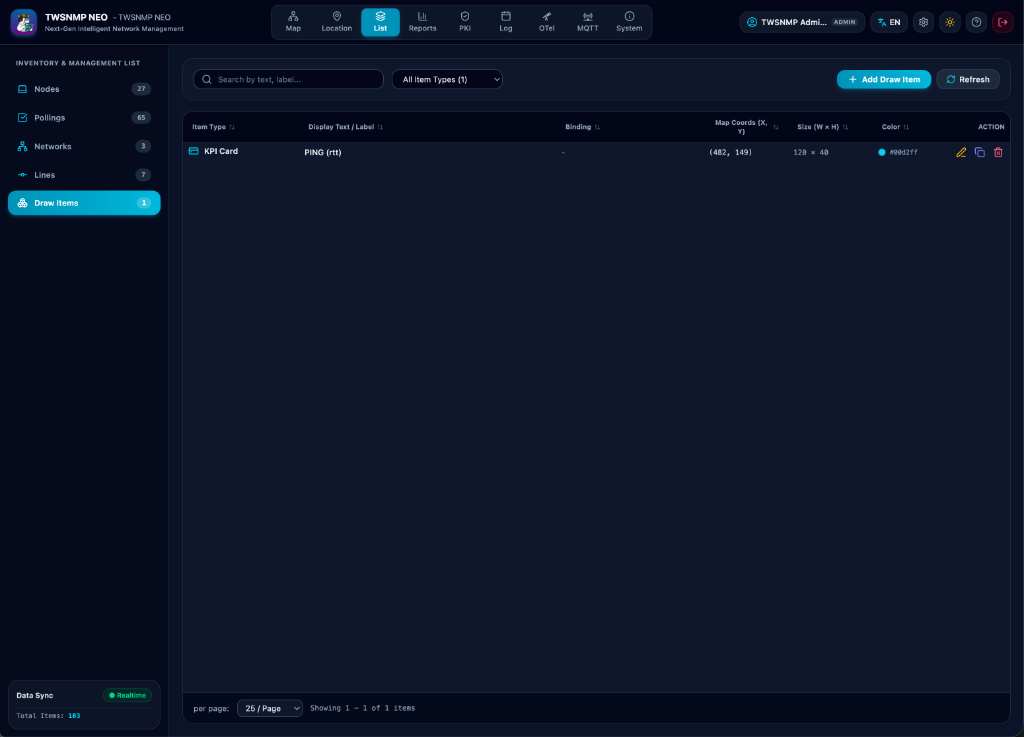
All configured draw items can also be audited and managed in the Draw Items inventory list:
3D Virtual Hardware Panel (vpanel)
Right-click any switch node and select Virtual Panel to launch the 3D WebGL hardware representation.
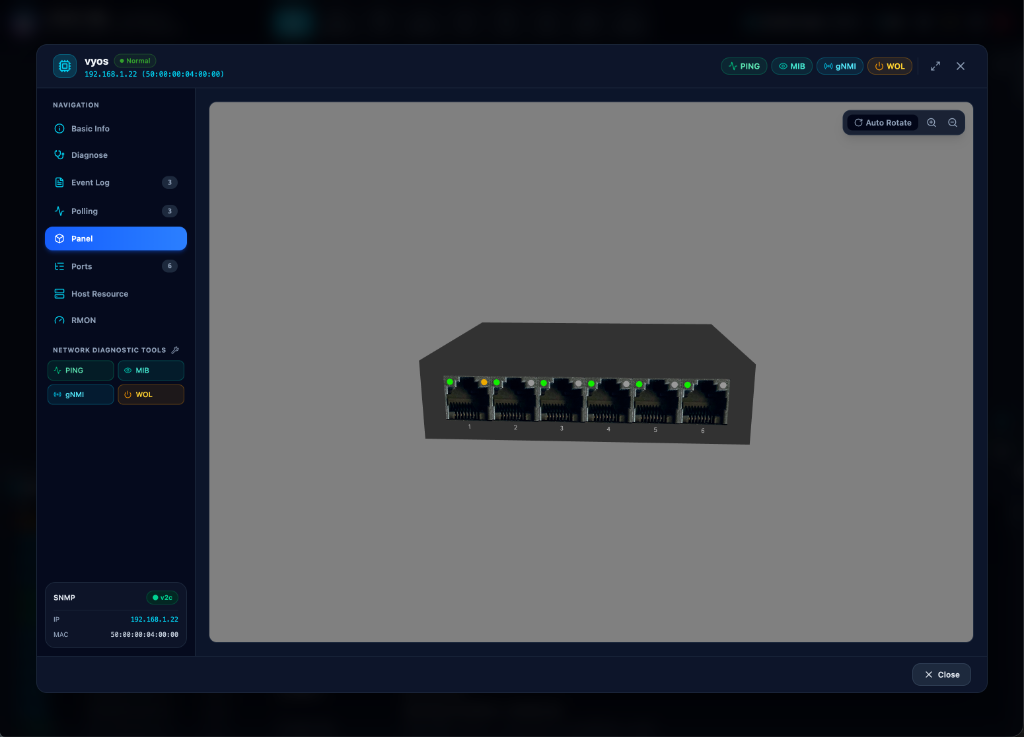
- Full 3D orbital rotation and zoom (Orbit Controls).
- High-resolution RJ45 port textures with active Link UP/DOWN green LEDs, 1Gbps+ speed amber LEDs, and Power LEDs.
Map Canvas Menu & Automatic Layout
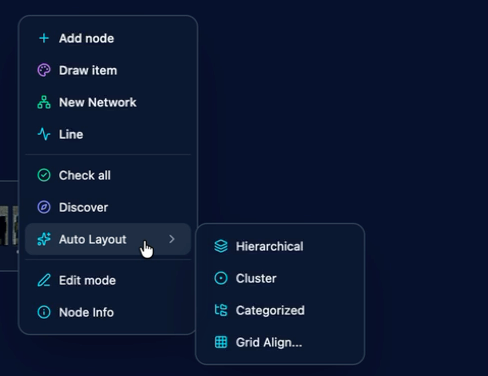
Right-clicking the empty map background opens the canvas context menu:
- Instant Element Creation: Quickly add nodes, networks, draw items, and lines directly to the canvas.
- Bulk Recheck & Auto-Discovery: Immediate polling recheck and discovery sweeps.
- Automatic Layout: Reorganize cluttered node topologies with algorithm-driven layouts (Hierarchical, Clustered, Categorized, Grid Alignment).
Map Settings & Background Images
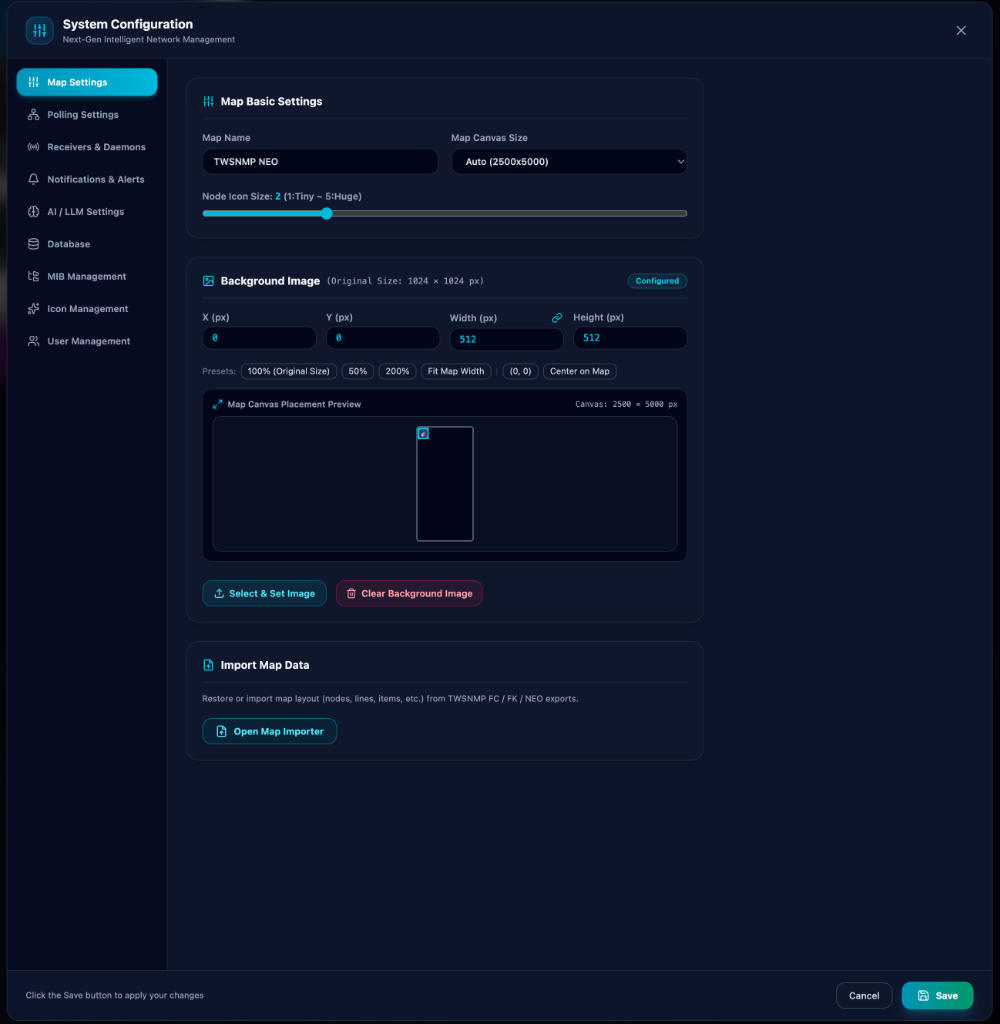
Configure global map appearance and underlying canvas properties:
- Map Name & Canvas Size: Auto-scaling or fixed virtual dimensions.
- Node Icon Size: 1 (Tiny) to 5 (Huge) slider adjustment.
- Background Image: Overlay network topologies onto architectural blueprints or regional maps with custom coordinate offsets and dimensions.
- Import Map Data: Restore layouts exported from TWSNMP FC, FK, or NEO.
GIS Location Map (MapLibre)
Powered by MapLibre GL, the GIS Location view visualizes node physical distribution across real-world geographic map layers based on each node’s latitude and longitude (Loc property). Ideal for wide-area networks (WAN) and multi-site campus infrastructure monitoring.
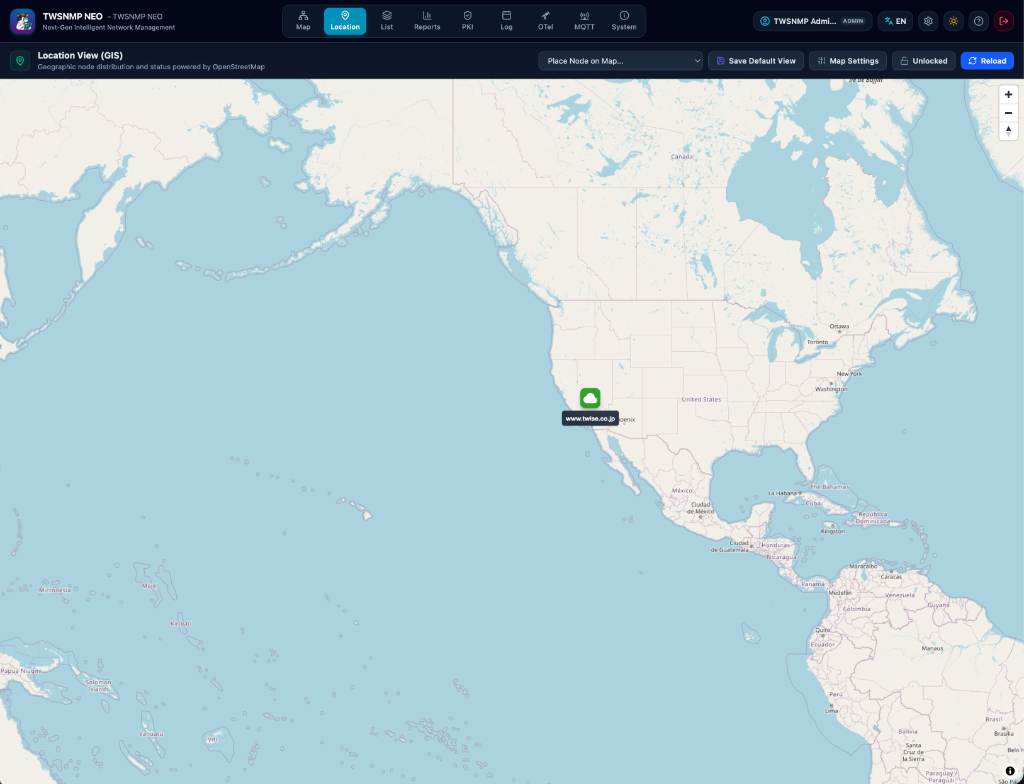
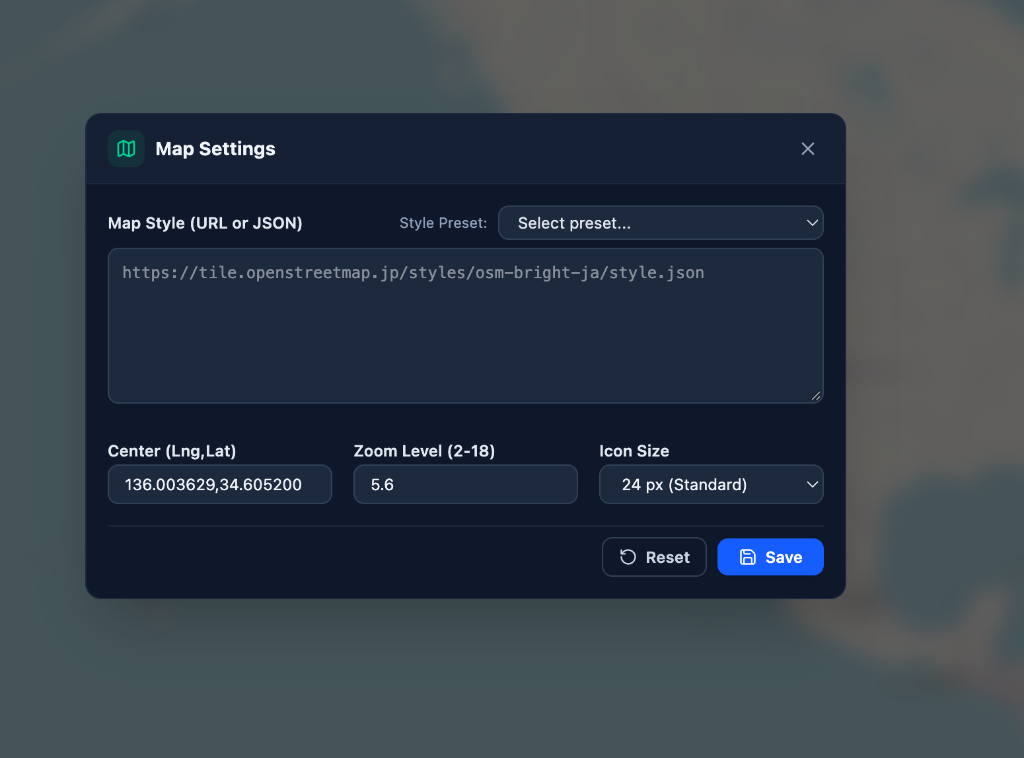
- Comprehensive Map Style Presets: Built-in map tile presets including Geospatial Information Authority of Japan (GSI Pale, Standard, Photo), CARTO (Dark / Light), OSM Bright, MIERUNE Mono, OSM Standard, or custom tile JSON/URLs.
- Intuitive Node Placement: Place unmapped nodes directly from the top selector dropdown or right-click any blank map point to summon the node placement dialog. Easily reposition nodes using marker drag-and-drop with instant coordinate persistence.
- Save Default View: Save the current map center and zoom level as the default startup viewpoint with a single click.
- Location Lock Toggle: Toggle editing mode to lock markers and prevent accidental dragging during monitoring operations.
- Real-Time State Indicators: Node marker icons and labels dynamically reflect real-time operational health (Normal, Warning, High Error, Critical).
5. Auto-Discovery & Topology Exploration
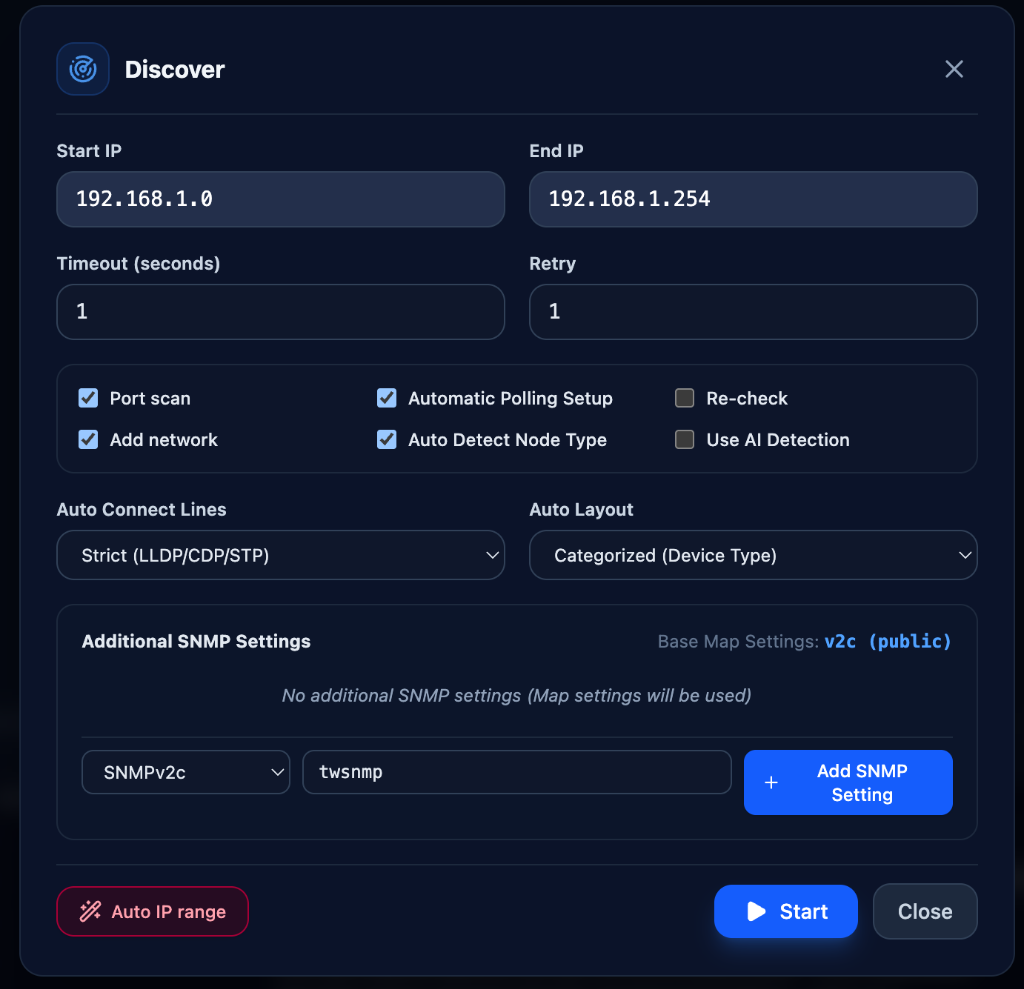
IP Range Auto-Discovery
Scan subnets (e.g., 192.168.1.0/24) using simultaneous ICMP Ping, SNMP walk, and ARP discovery to populate maps automatically.
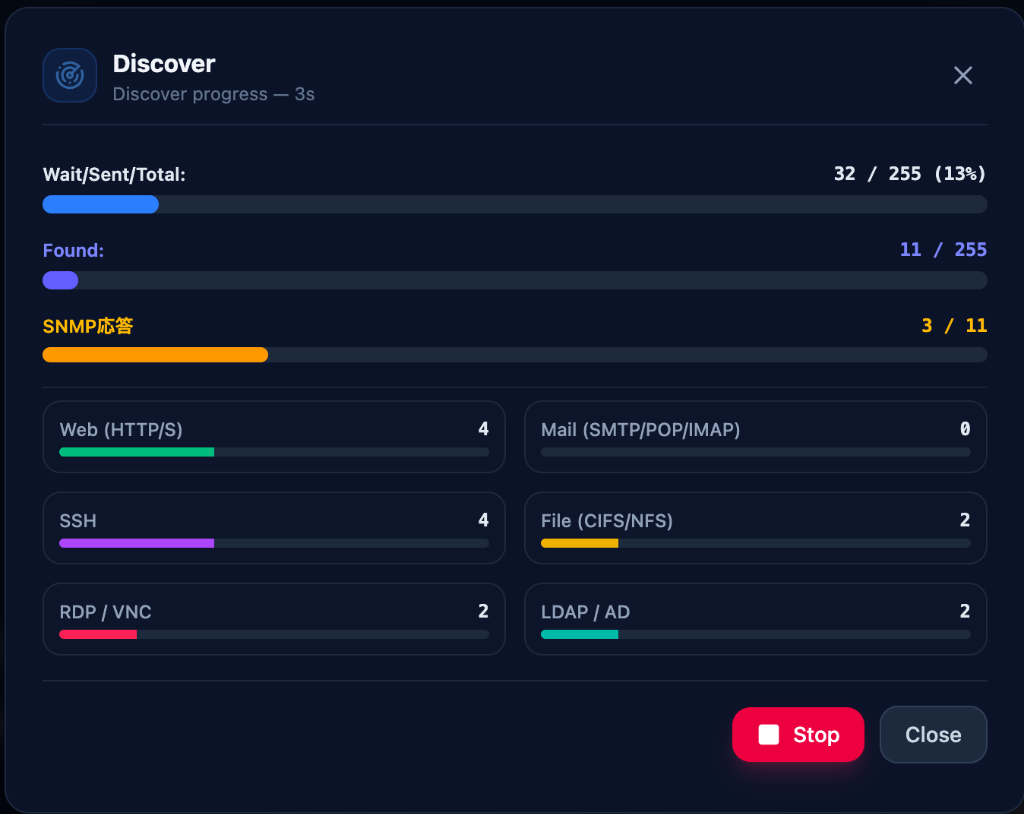
During execution, real-time discovery progress and categorized service detection counters (SNMP, Web, SSH, Mail, File, RDP, LDAP) are displayed:
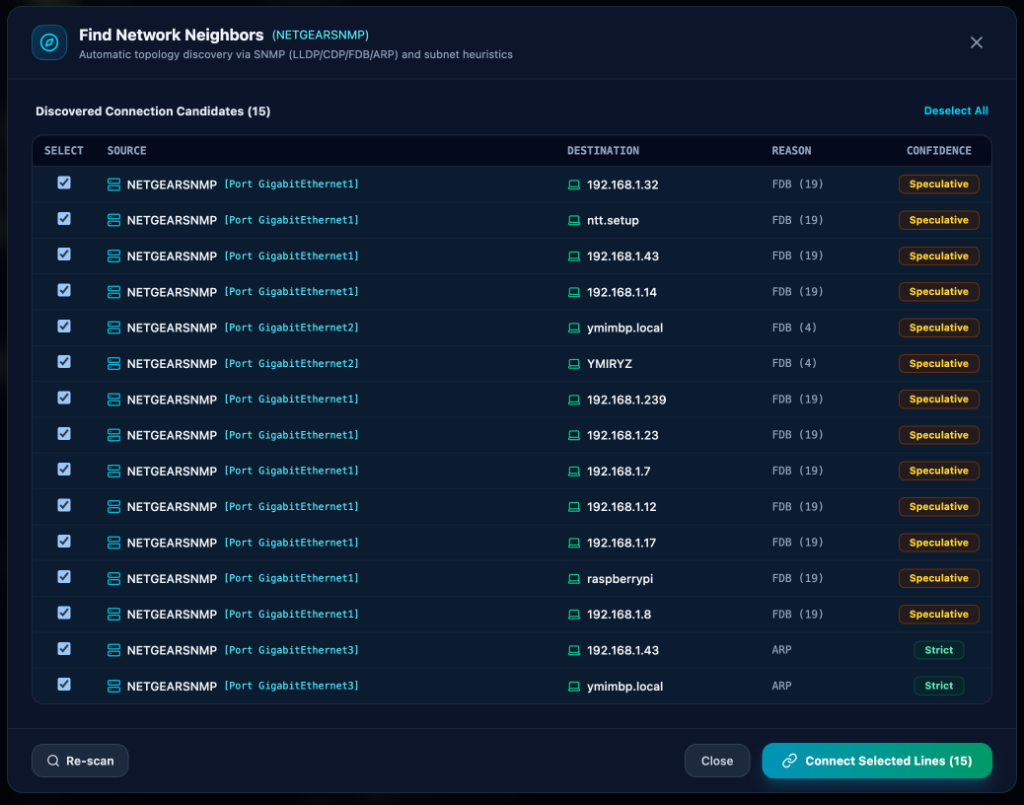
Neighbor Topology Finder (Find Neighbor)
Inspects switch ARP caches, Bridge MIB FDB tables, and LLDP/CDP neighbor tables to automatically identify and connect nodes to their exact switch ports. The widened dialog eliminates text truncation and displays detection reasons (LLDP, FDB-Edge, ARP) alongside confidence percentages (%):
6. Node & Polling Management
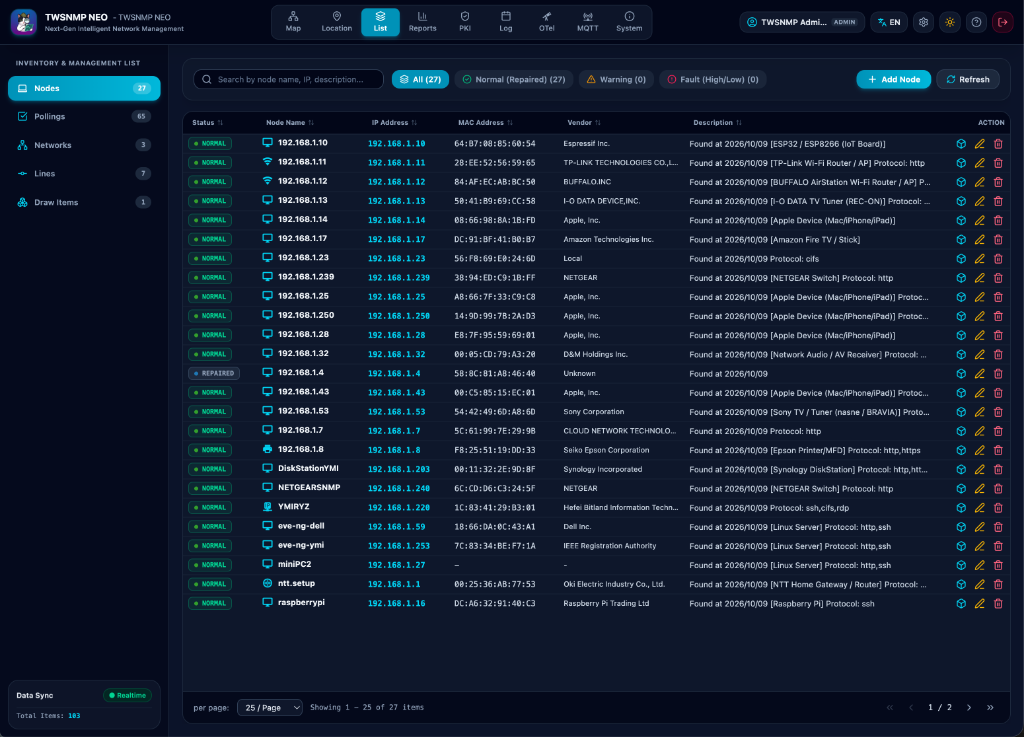
Node List & Node Details
View and manage all monitored nodes, IP/MAC bindings, hardware vendors, and operational states in a real-time searchable inventory list:
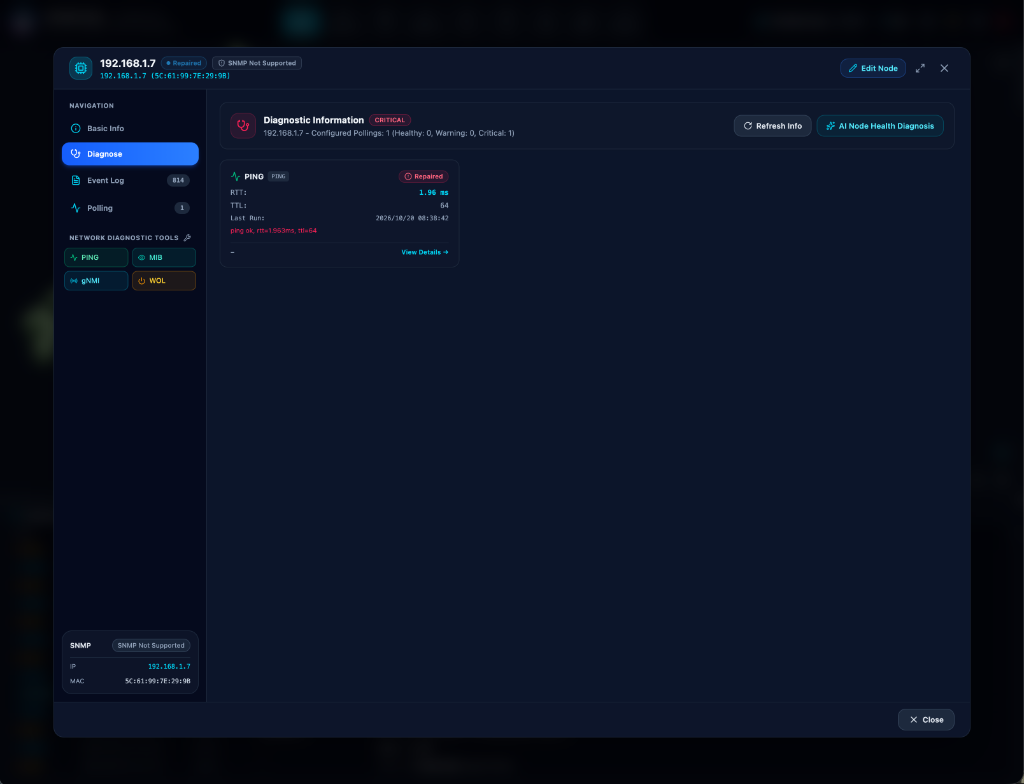
Right-clicking any node and selecting “Info” opens the Node Details view, displaying system health metrics and an inline list of all configured pollings. Users can inspect polling trend charts, jump directly into polling edits, or launch node editing via the dedicated top-level action button.
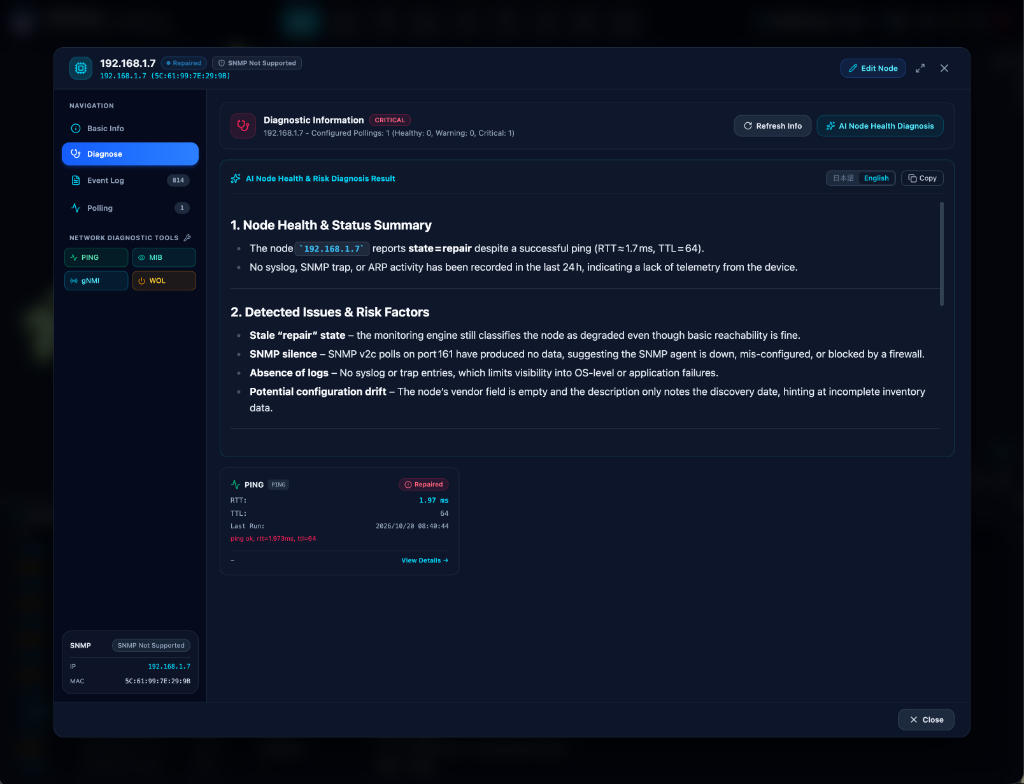
Clicking the AI Node Health Diagnosis button triggers an LLM evaluation of node status, active polling warnings, and risk factors, rendering root cause explanations and recommended remediation actions in structured Markdown with bilingual (Japanese/English) toggling:
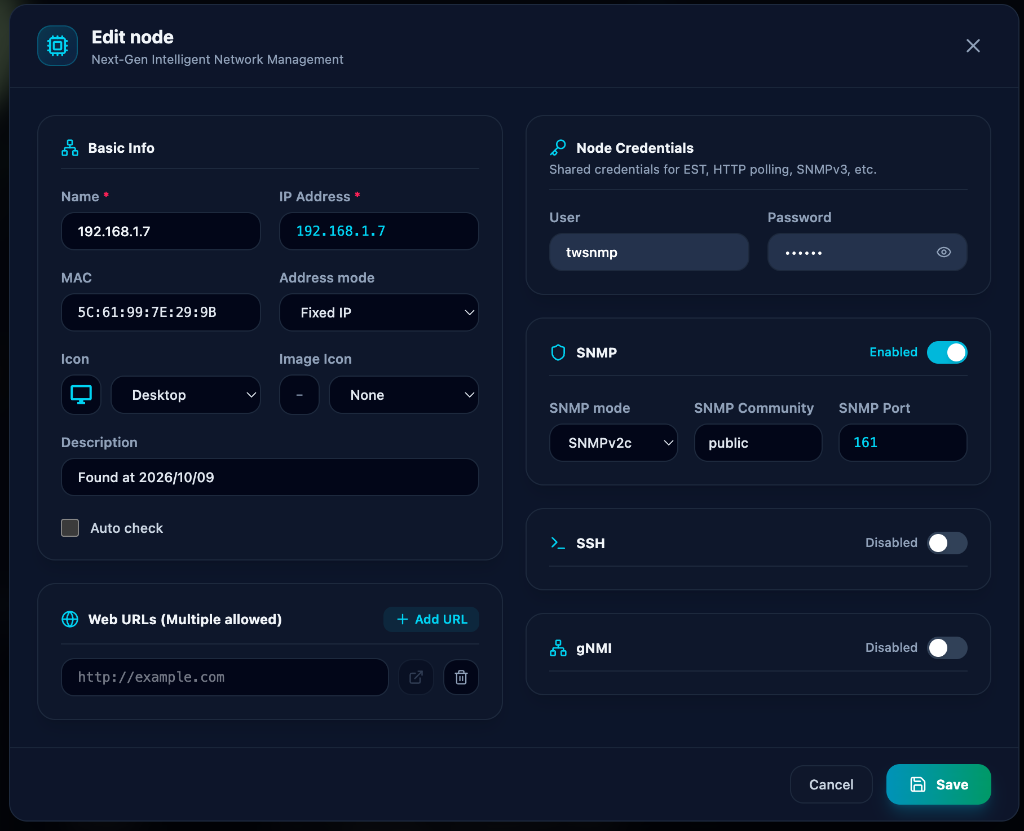
Node Property Editor (2-Column & Shared Auth)
The node configuration dialog features an expansive two-column layout:
- Left Column (Primary Information): Hostname, IP address, MAC address, address mode, icon selector (MDI or custom graphics), description, and auto-recheck option.
- Right Column (Protocols & Credentials): Protocol-sensitive input fields, multiple URL endpoints for web monitoring, and one-click credential application from global Shared Credentials presets.
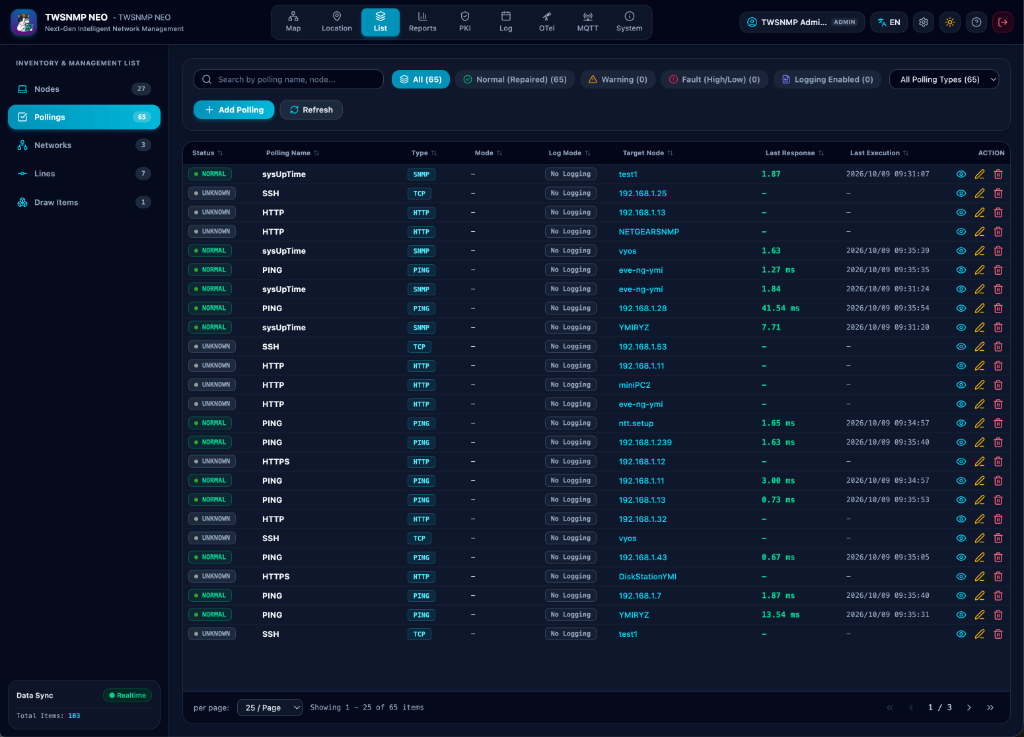
Extensive Polling Protocols
- PING: ICMP, UDP, Smokeping, MTR
- SNMP: v1 / v2c / v3 Get, Walk, and Table extractions
- HTTP / HTTPS: Response codes, latency, body regex matching, SSL validity, dynamic JSON metrics (
metrics/json) - AI / LLM Endpoint Monitoring (
http): Health, latency (rtt_ms), and available model count (models) monitoring for OpenAI-compatible (/v1/models) and Ollama (/api/tags) endpoints with auto-bearer token extraction - OpenTelemetry APM (
otel): OTel metrics aggregation (Gauge/Sum direct calculation, min/max/count/elapsed), distributed trace evaluation (error rate, P95 duration, HTTP 4xx/5xx and gRPC errors), and telemetry heartbeat loss detection - TCP / TLS: Port reachability and handshake latency
- DNS / NTP: Query resolution and time offset
- gNMI: gRPC telemetry streaming and config inspection
- STUN: Public IP monitoring and NAT type detection
- MQTT: IoT topic subscription and metric assertion
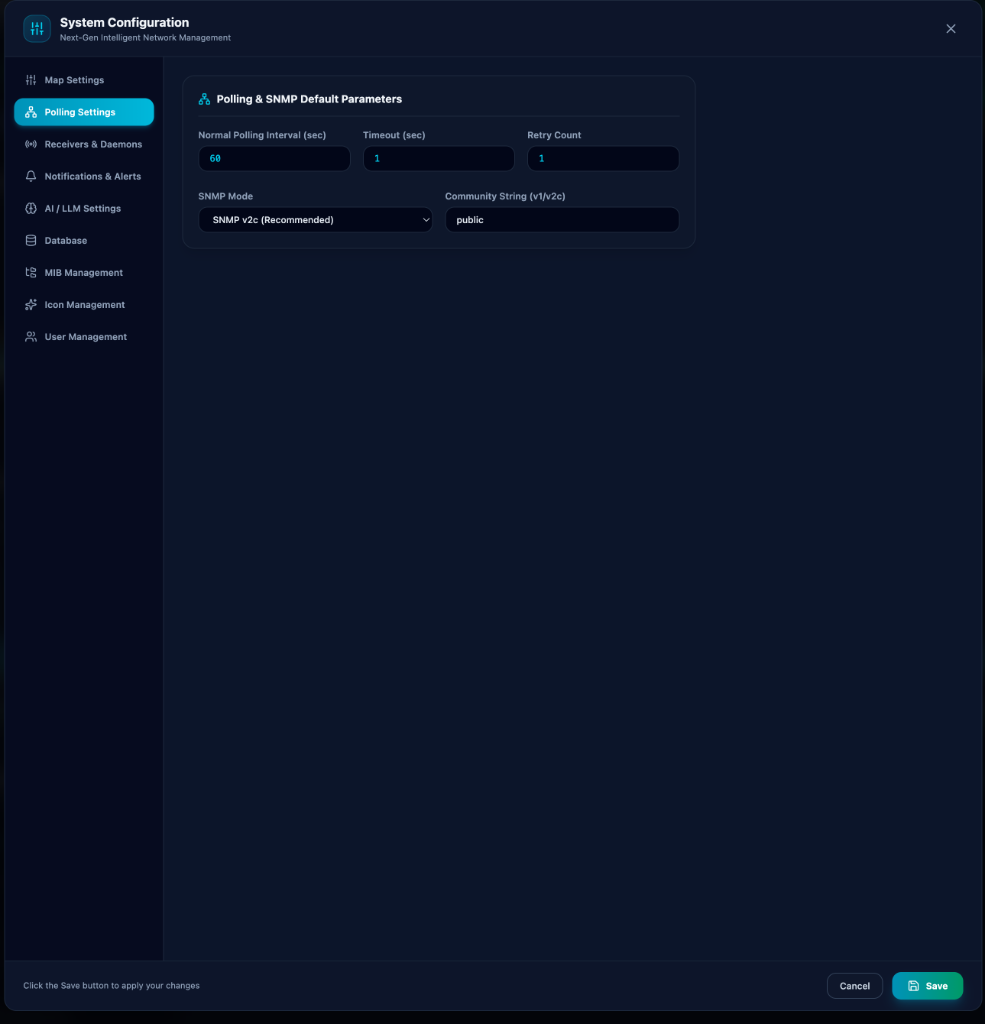
Global default polling parameters (interval, timeout, retry count, SNMP mode, community string) can be configured under System Configuration:
AI Polling Setup Assistant
Describe monitoring requirements in natural language (e.g., “Create a polling that alerts if CPU utilization exceeds 85%”), and the AI automatically generates the appropriate OID, polling type, and threshold expression. (Experimental feature under development)
7. Diagnostic & Operational Tools
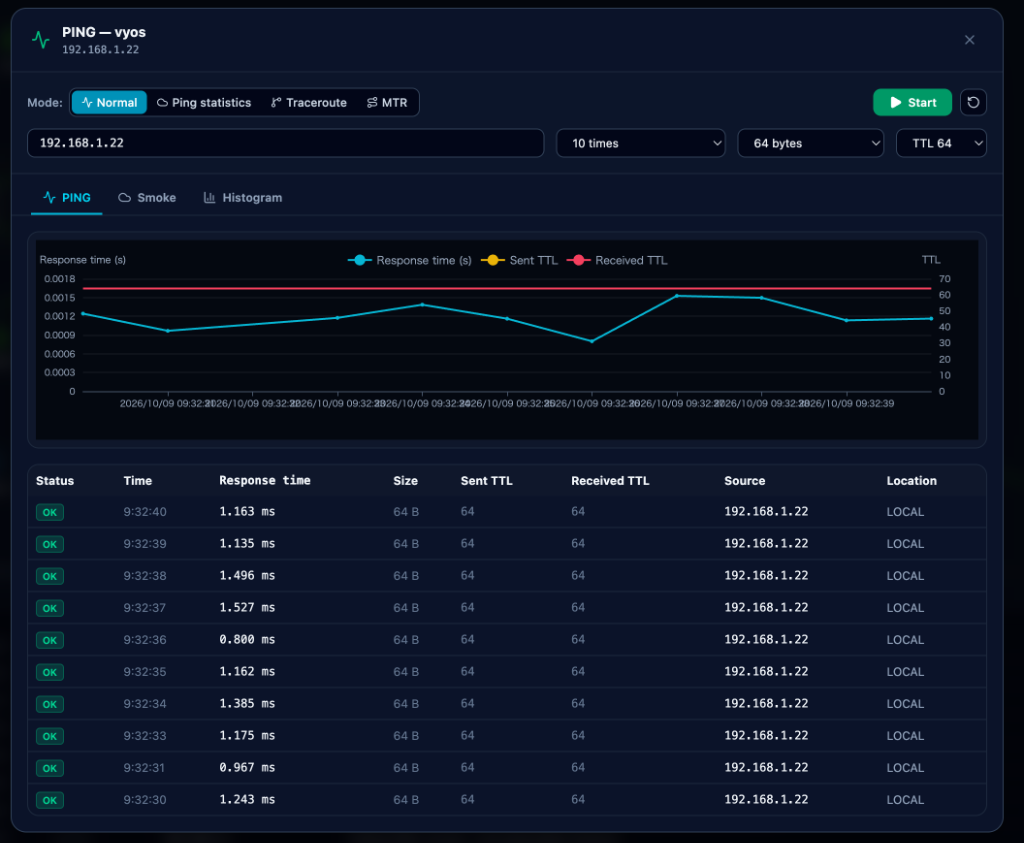
Ping / Smokeping / MTR
- Real-Time Ping: Continuous ICMP/UDP ping with real-time response graphs and audio cues.
- Smokeping: Visualizes latency jitter and packet drop distributions.
- MTR: Per-hop traceroute latency statistics with AI diagnostic summaries.
MIB Browser & MIB Tree Explorer
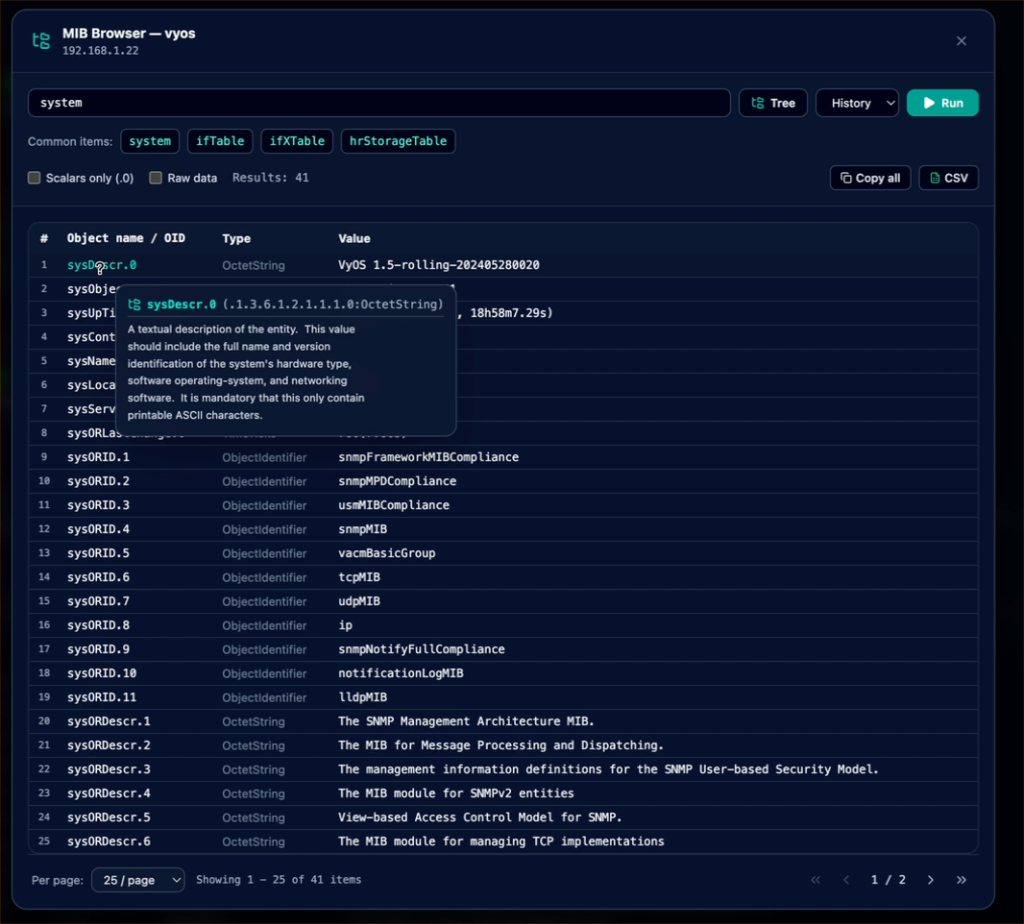
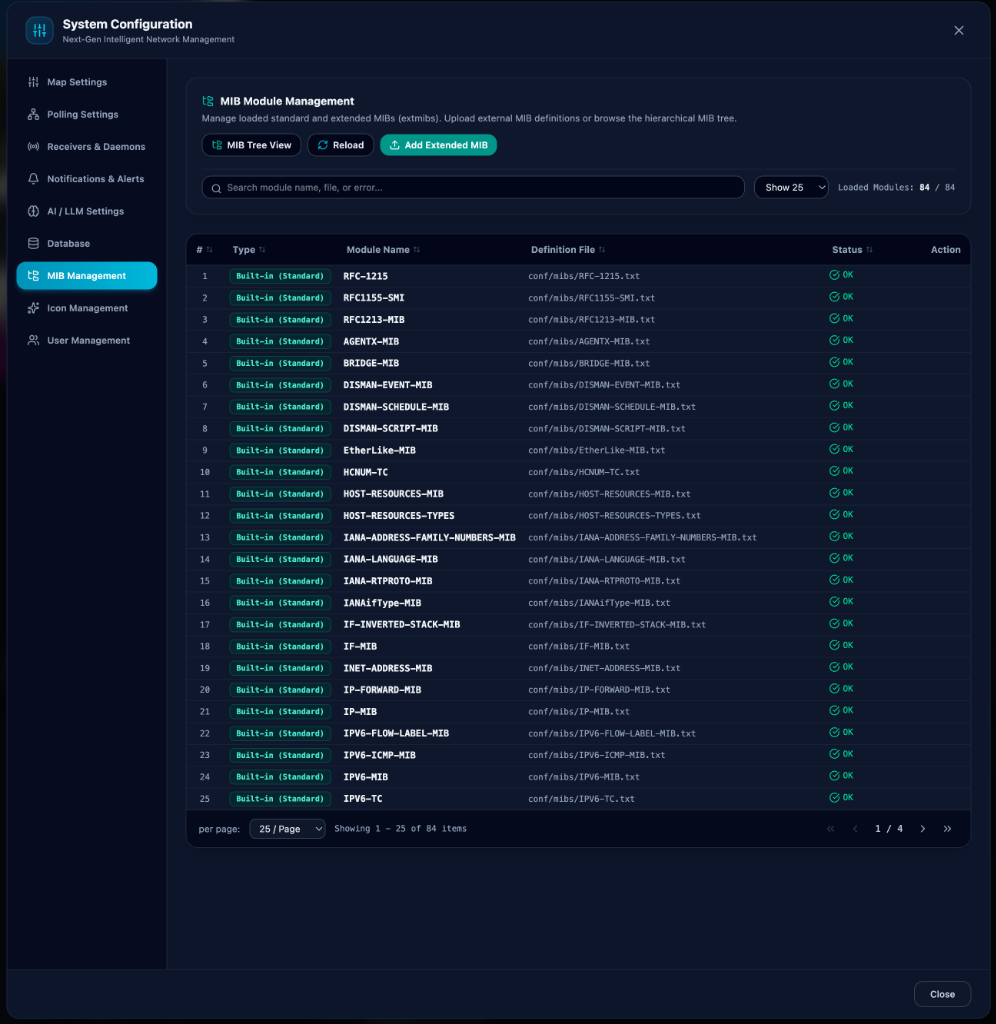
Browse standard RFC MIBs and vendor private MIB trees. Perform Get / GetNext / Walk / Table operations, sort table columns, and export data directly to CSV.
gNMI Tool
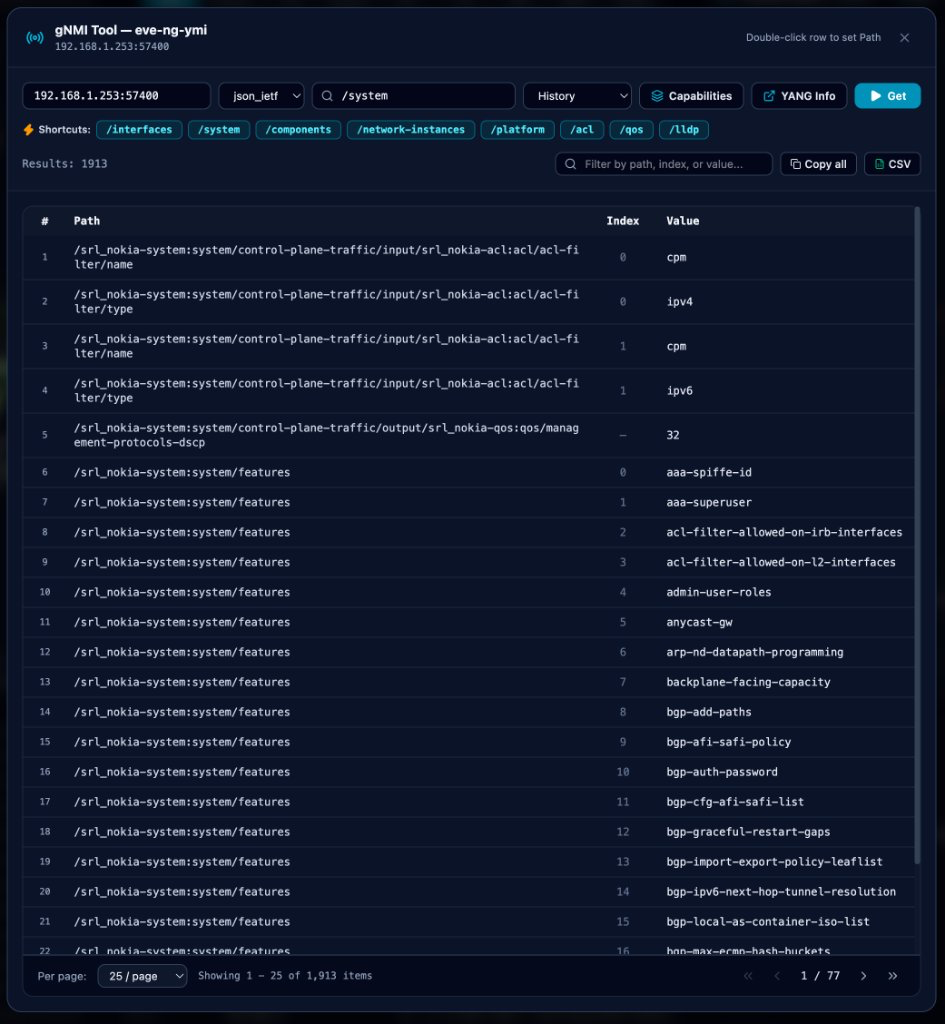
Query modern telemetry streams and inspect configurations over gRPC. Features resizable table columns, inline real-time search, pagination (10 to 100 items), and keyboard shortcuts (Enter to Get, Escape to close).
Wake-on-LAN (WOL)
Execute directly from the node’s right-click context menu on the map or via the “WOL” button at the top of the Node Details modal. Broadcasts Magic Packets to the target MAC address for instant remote power-on.
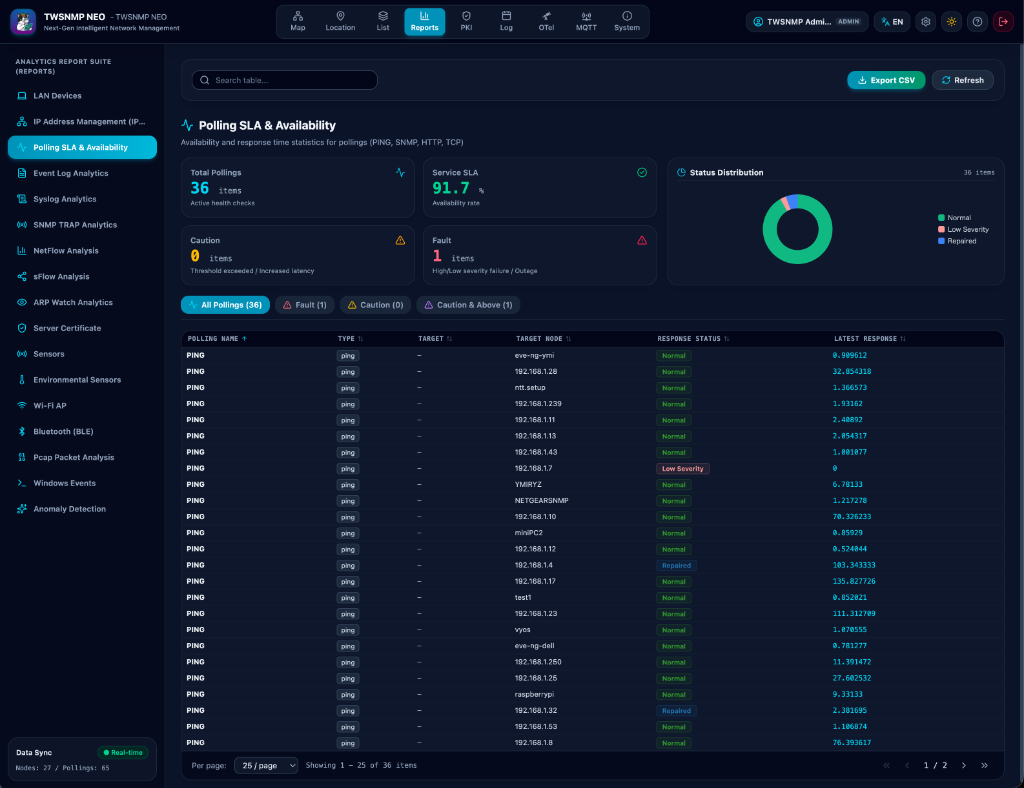
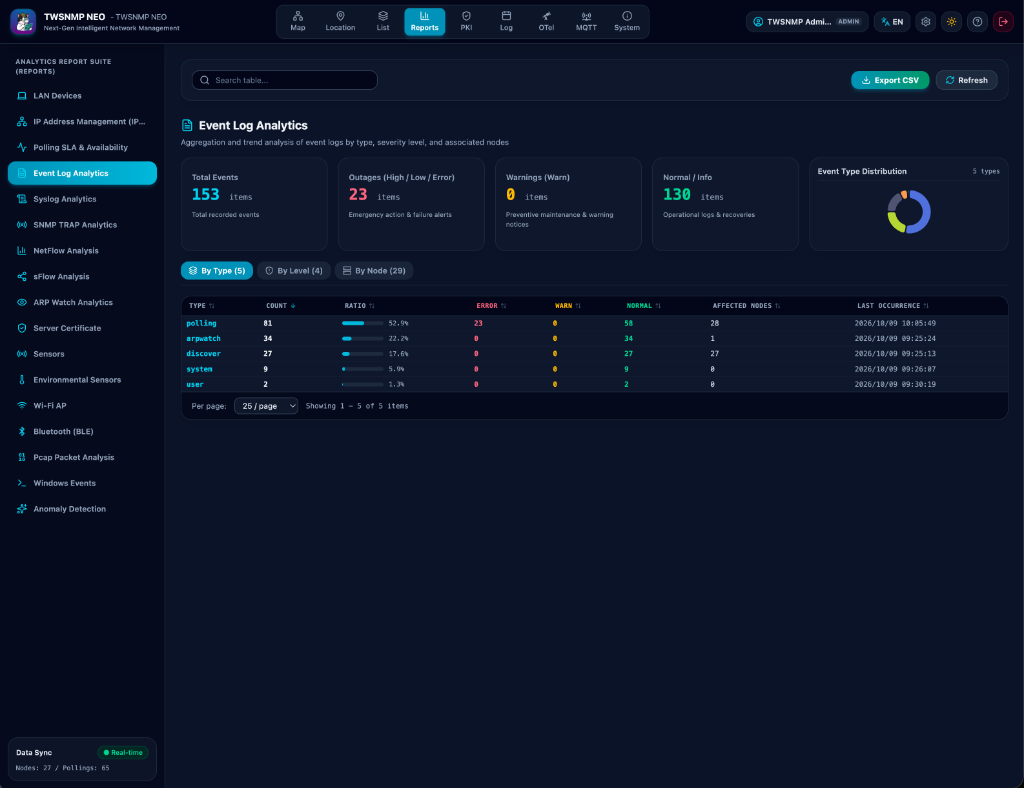
8. Analytics & Reporting Suite
TWSNMP NEO incorporates 10 dedicated analytics engines:
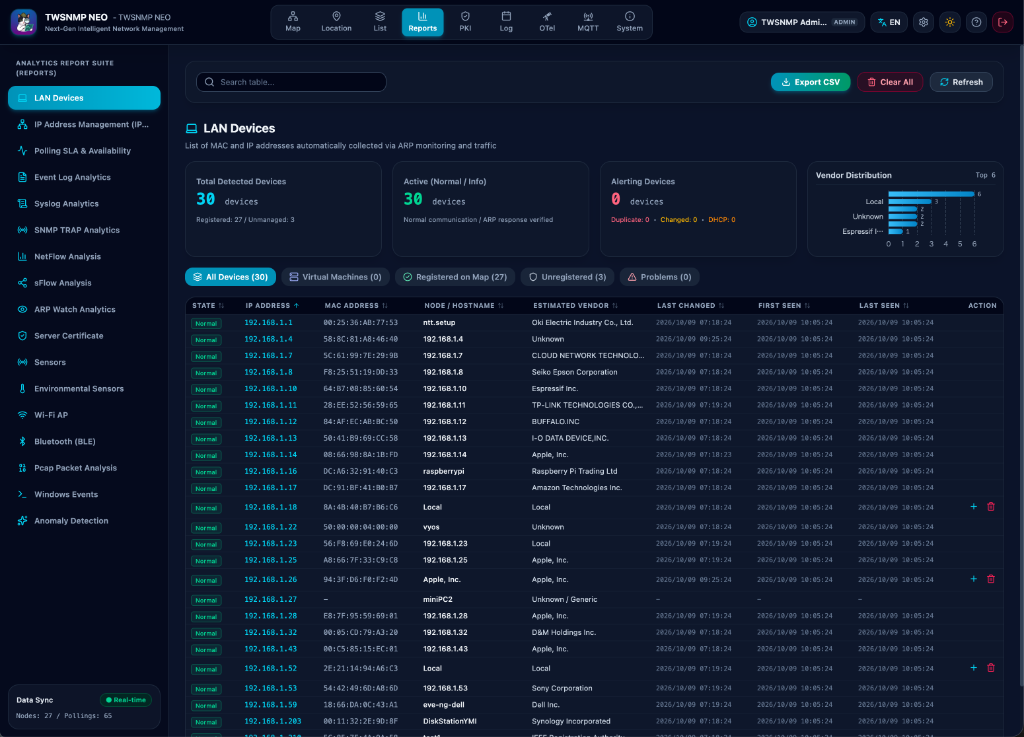
Device Analytics (LAN / Wi-Fi / Bluetooth / FDB)
Vendor OUI breakdown, signal strength, and rogue device tracking.
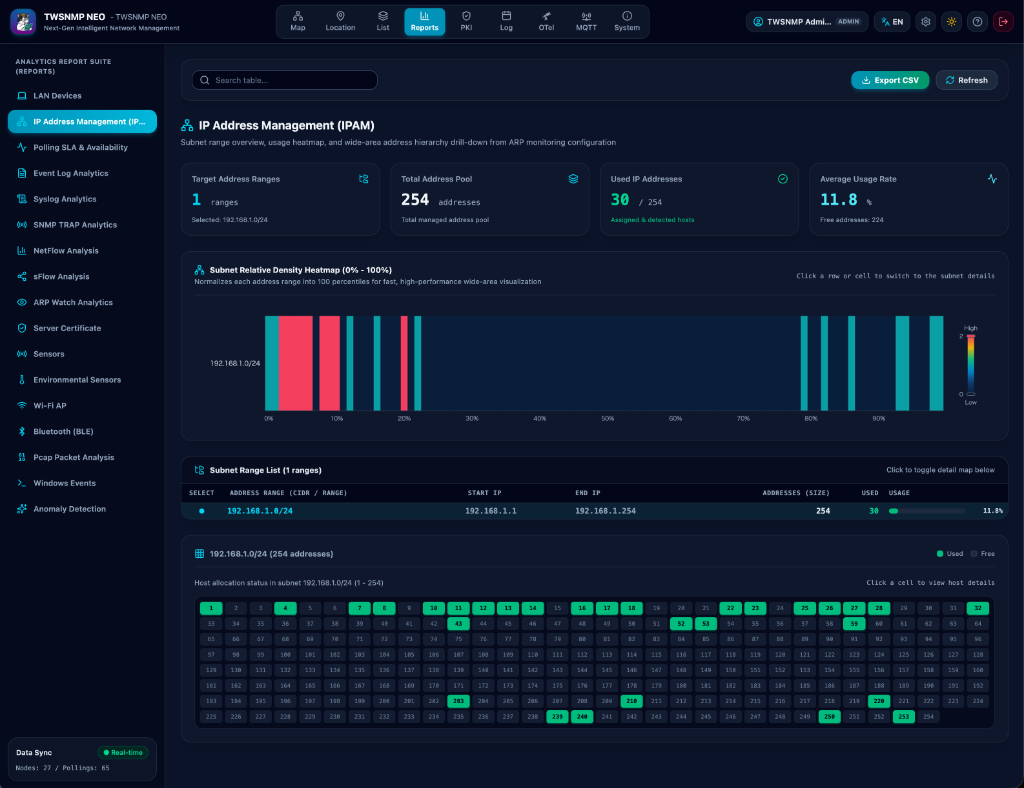
IPAM (IP Address Management Heatmap)
Multi-subnet utilization heatmaps and IP conflict detection.
Flow & Traffic Analysis (NetFlow / sFlow / Fumble)
Top talkers, top ports, and Fumble anomalous connection tracking.
Host Analysis (Windows Events / Processes)
Windows Security event auditing, privilege escalation, and active processes.
IoT & Environmental Sensors (Temperature / Power)
Temperature, humidity, pressure, and energy consumption (Wh) trends.
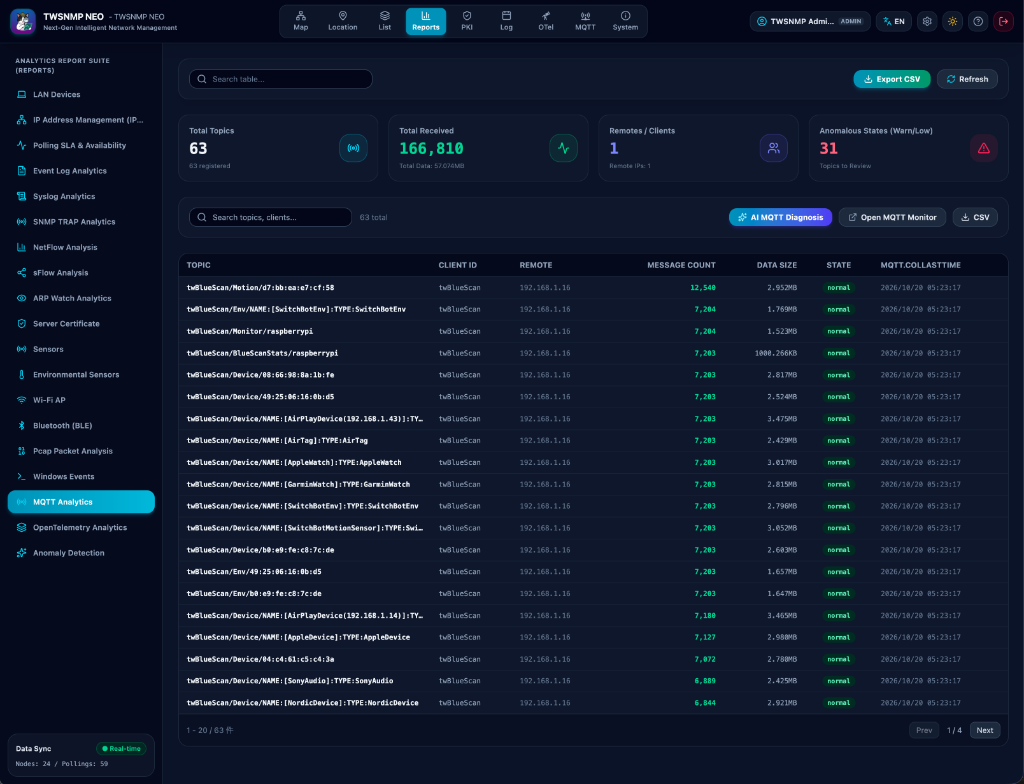
MQTT Reports
IoT/Smart device message volume statistics by topic, client connections, and AI trend summaries.
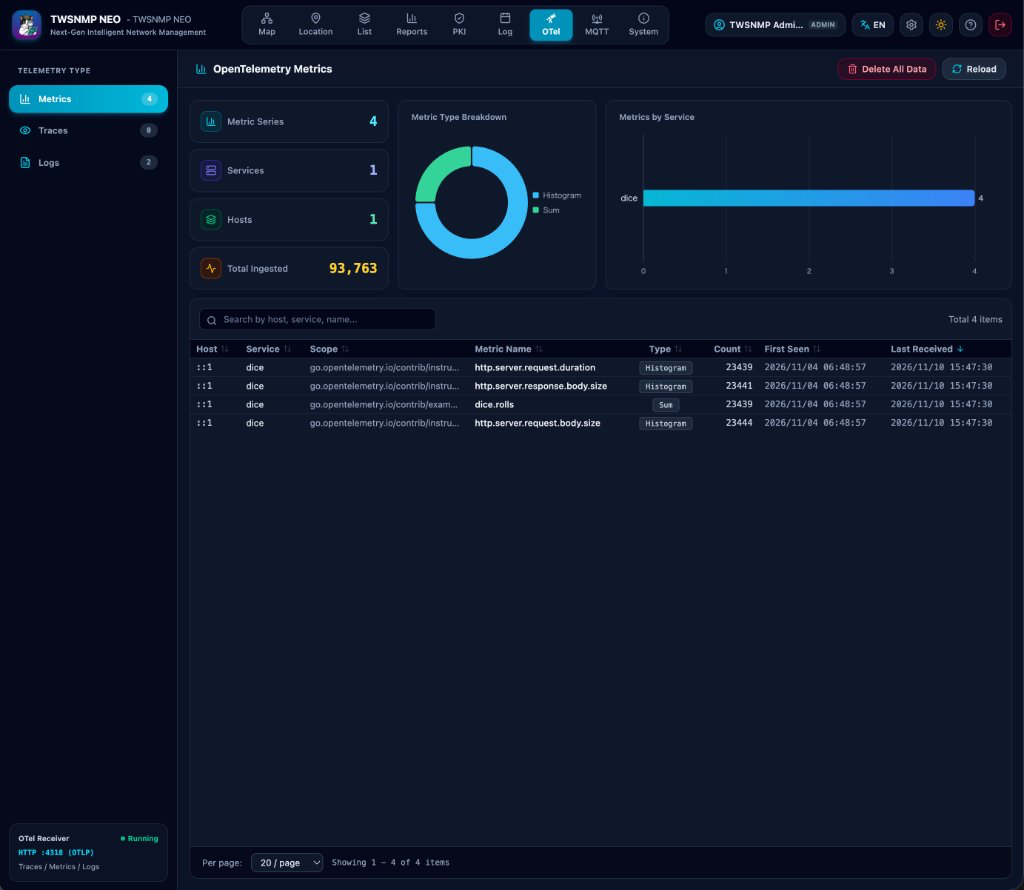
OpenTelemetry (OTel) Reports
Distributed trace summaries, service latencies, and AI bottleneck diagnostics. Features a top header action bar for reload, report, and deletion, along with one-click polling creation directly from metric and trace tables (with automatic hostname and IP address node matching).
TWAgent & AI Security Audit (twagentneo)
Integrates rich telemetry and AI security audits from cross-platform twagentneo agents across MQTT, Syslog (RFC 5424), and SNMP TRAP without prior manual configuration:
- Agents Inventory & Telemetry (
twAgentInfo): Agent ID, hostname, IP, OS, version, online/offline status (LWT/heartbeat), live CPU/memory/disk rates, and network throughput, with one-click topology node and polling registration. - AI Security & Compliance Alerts (
twAgentAlert): Sigma rule matches analyzed by local LLM (tensai) with threat validation (IsThreat: YES/NO), severity ratings, Japanese summaries, and remediation actions. - File Integrity Monitoring (
twAgentFIM): Real-time event log of file creation, modification, deletion, and permission changes with SHA256 hashes. - Security Configuration Assessment (
twAgentSCA): CIS Benchmark-aligned system and security configuration audits with masked proofs, actionable remediation steps, and AI root cause summaries. - Process TCP Connections (
twAgentTCP): Active outbound/inbound TCP socket destinations per process with GeoIP mapping, service identification, and statistical deviation scoring.
TLS/SSL Certificate Monitoring
Expiration countdown and revocation status verification.
AI Anomaly Detection Scores
Statistical anomaly scoring and ranking across nodes and pollings.
One-Click “AI Diagnosis” Across All Reports
Click the “AI Diagnosis” button on any report toolbar (Syslog, TRAP, NetFlow, IP, ARP, Sensor, MQTT, OTel) to trigger instant LLM analysis of the current statistical data, producing bottleneck insights and actionable remediation steps in structured Markdown with smooth loading animations.
9. High-Speed Log Management (Apache Parquet)
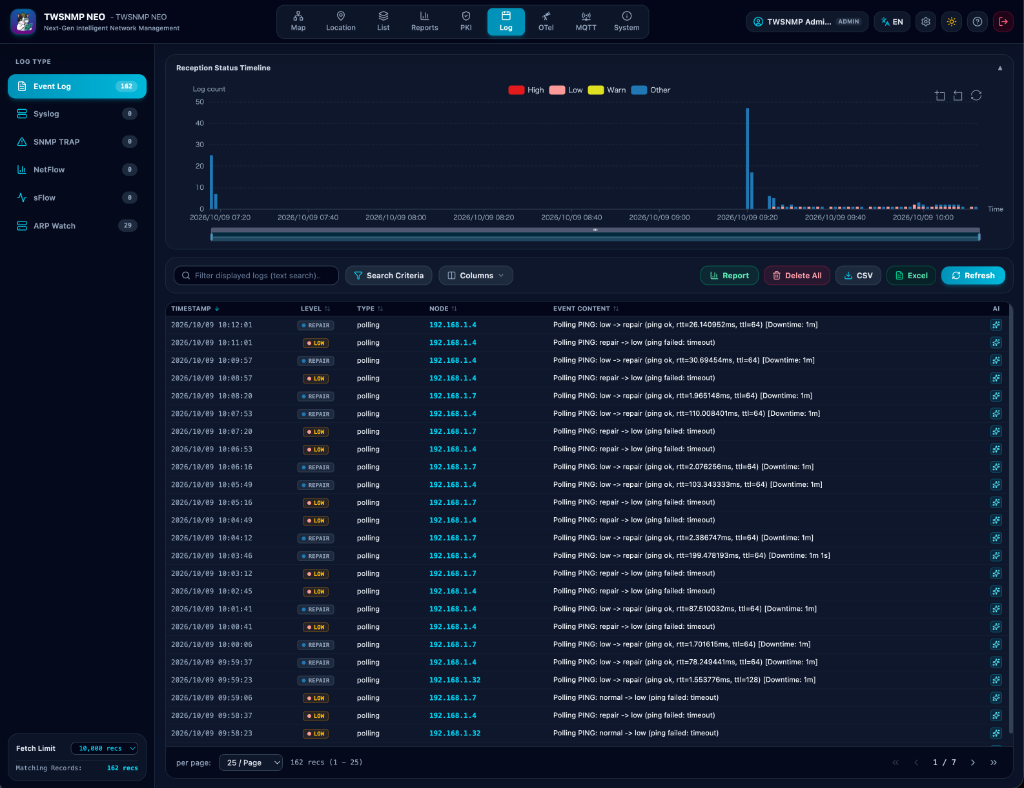
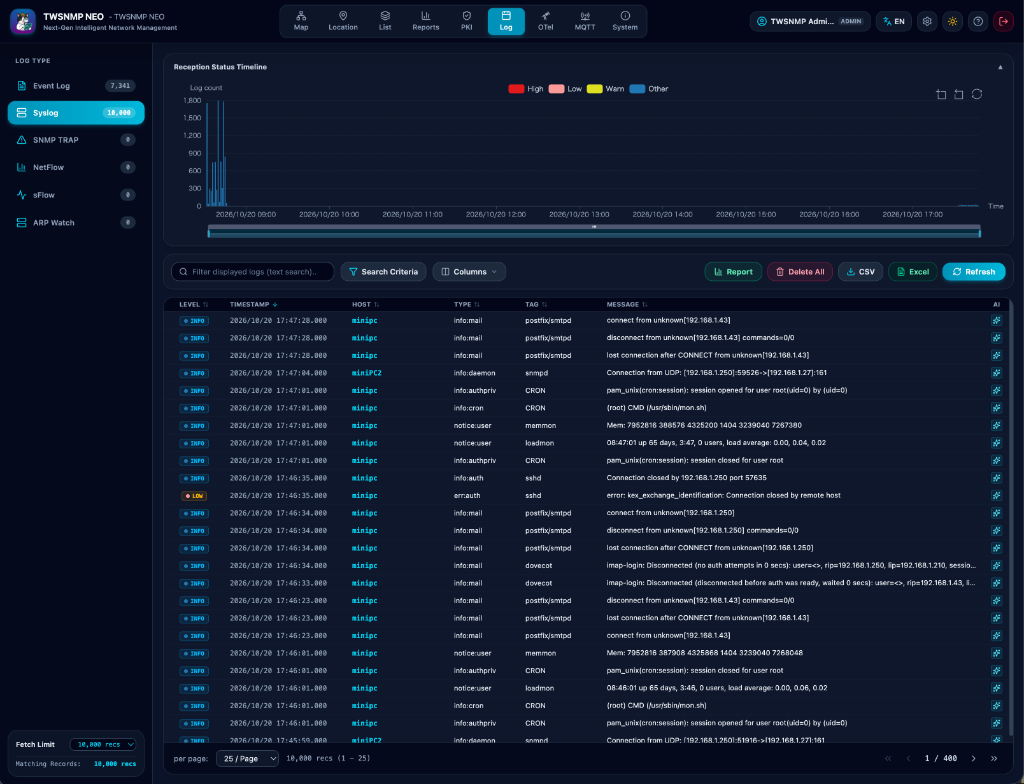
Built on Apache Parquet columnar compression, TWSNMP NEO processes massive log volumes with exceptional speed and minimal storage overhead.
Supported Log Types
- Event Logs: System lifecycle events, status changes, and AI Root Cause analysis.
- Syslog: UDP/TCP/TLS reception, severity breakdowns, log normalization, and FFT periodicity analysis.
- SNMP TRAP: v1/v2c/v3 traps with MIB OID name translation.
- NetFlow / IPFIX & sFlow: Flow samples and counter telemetry.
- ARP Watch: Continuous IP-MAC binding change and conflict logs.
- OpenTelemetry: Distributed traces and OTLP log ingestion.
- MQTT Logs: Real-time IoT message histories.
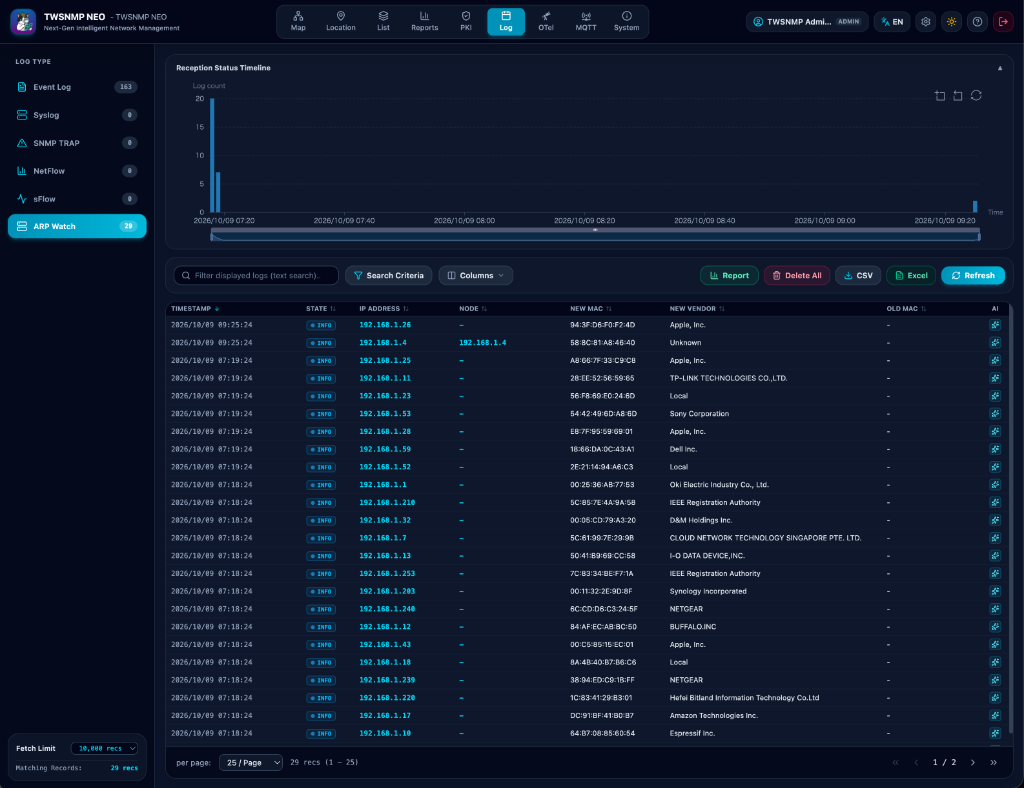
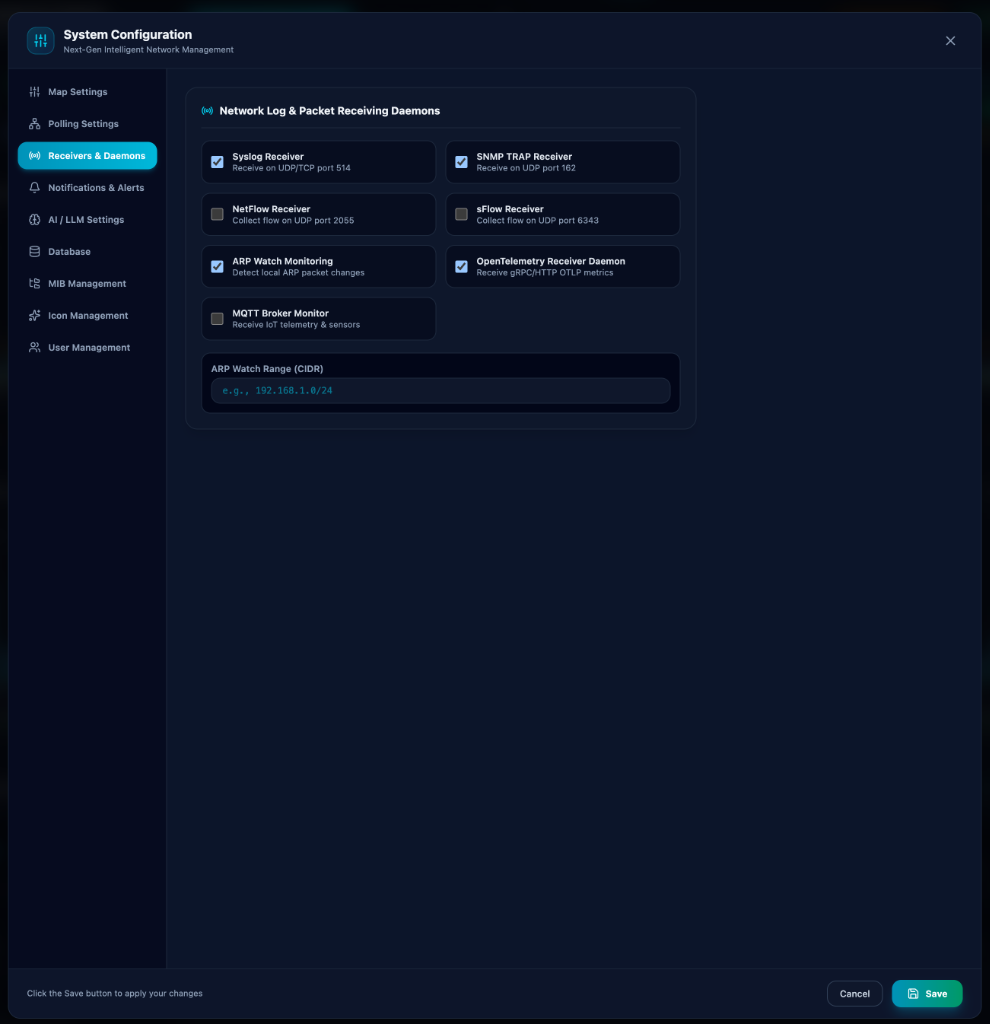
Receivers & Daemons Settings
Log and packet receiving daemons (Syslog UDP/TCP:514, SNMP TRAP UDP:162, NetFlow UDP:2055, sFlow UDP:6343, ARP Watch CIDR, OpenTelemetry OTLP gRPC/HTTP:4318, MQTT Broker) can be enabled or configured under Receivers & Daemons settings. Configuration updates dynamically reload and restart target daemons without restarting the application. Full support for SNMPv3 TRAP decryption and MIB OID name resolution is built-in.
Independent Log Retention Policy & Parquet Compaction
Database event logs (bbolt) and high-volume streaming logs (Parquet) feature independent retention periods. A background cleaner runs every 10 minutes to automatically purge expired bbolt event records and rotate Parquet files based on both age and disk quotas.
In addition, in-memory caching (sync.Map) with deferred batch flushing, fast timestamp range query pruning, and automated background file compaction (Compact) ensure peak query speeds and low disk fragmentation across years of operation.
Probe Tag Auto-Parsing & Cached Reverse DNS
Automatically recognizes and normalizes syslog probe tags (twpcap, twWifiScan, twBlueScan, twwinlog, twagentneo, etc.) even when upstream relays embed or prepend tags to hostnames, extracting clean type= key-value payloads. In addition, report generation automatically executes reverse DNS lookups for unregistered IP nodes, caching hostnames with a 1-hour TTL for high-performance zero-delay visualization.
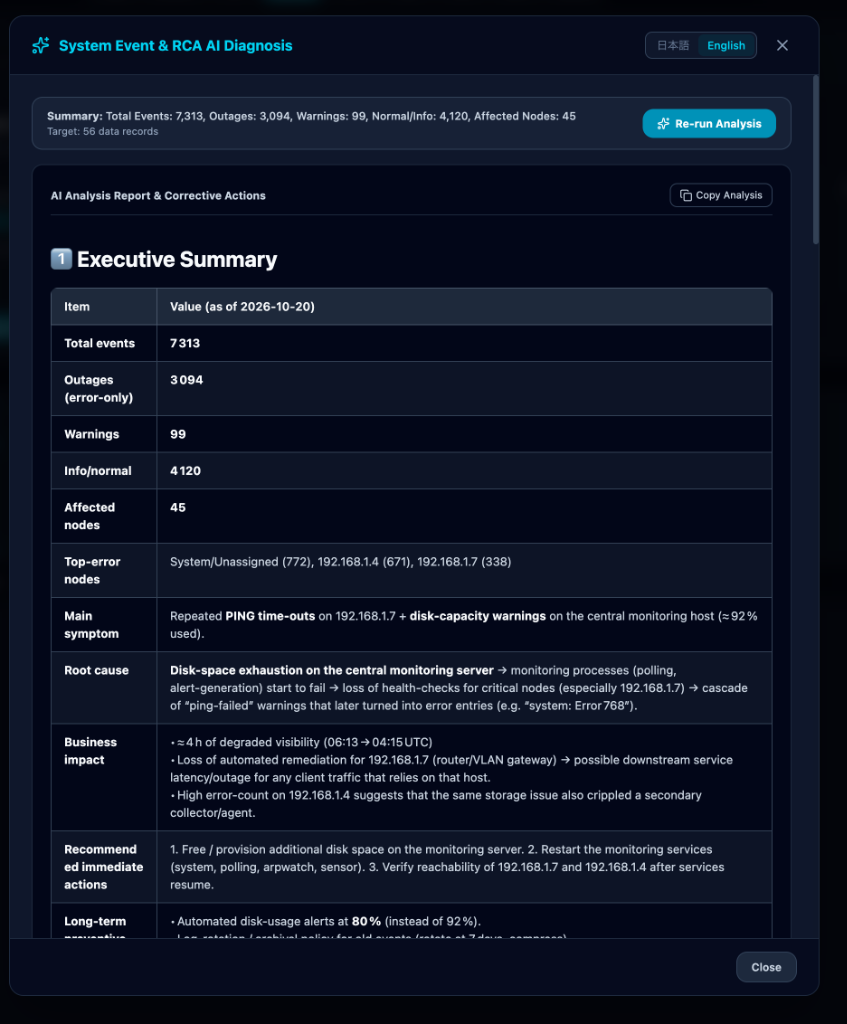
AI Root Cause Diagnosis
When critical events occur, one-click AI analysis summarizes correlated preceding and succeeding logs to identify the root cause and provide clear remediation steps in Markdown.
10. Built-in PKI (Certificate Authority) & TLS Management
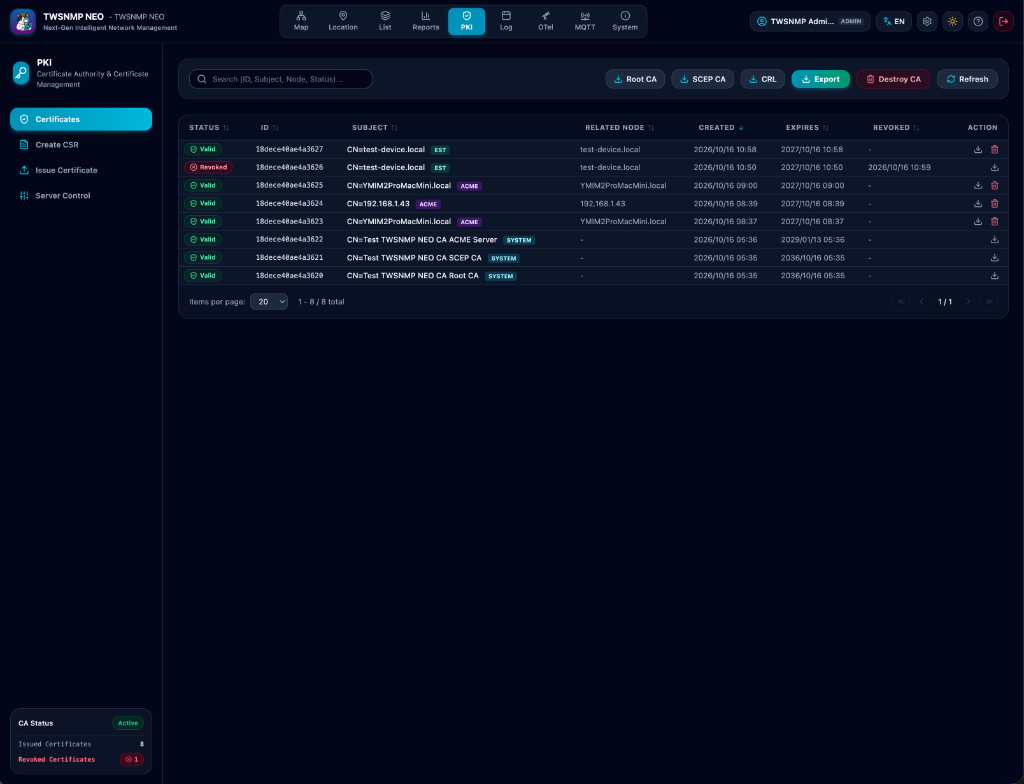
A complete, self-contained Private PKI system embedded directly within your network manager. Modeled after the production-grade TWSNMP FC Web server architecture, it offers an intuitive left-sidebar interface with full protocol server integration.
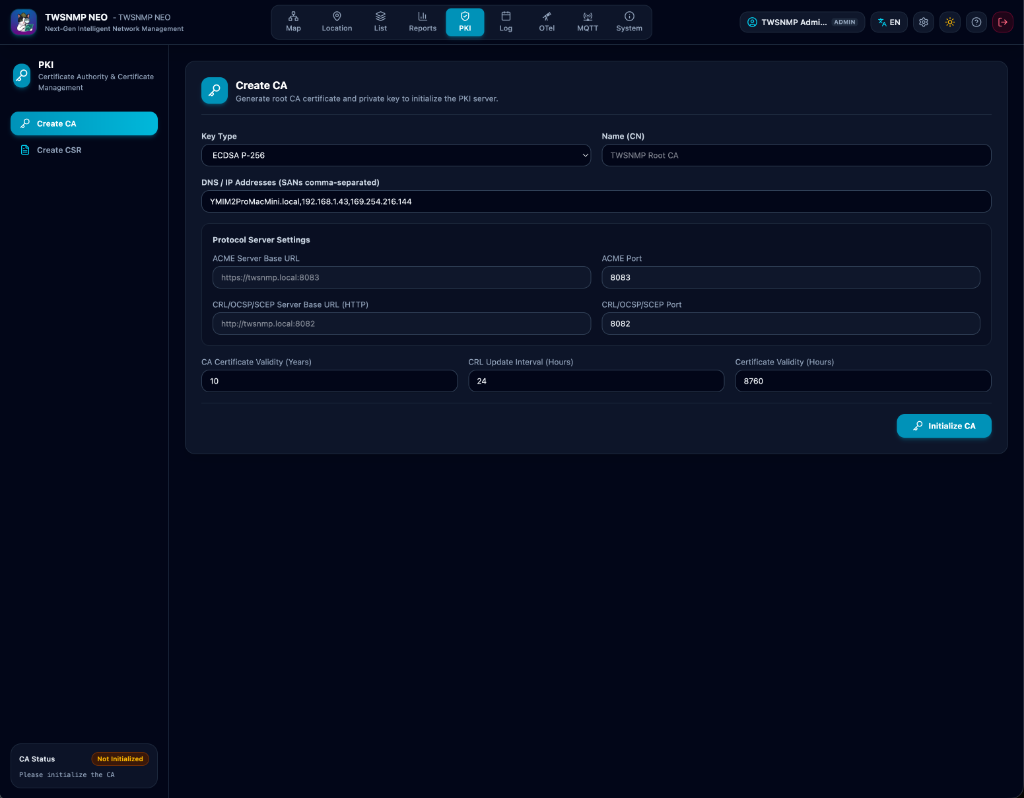
Root CA Setup & Certificate Ledger
Generate Root CA keys and certificates securely (supporting RSA and ECDSA key curves) with explicit initialization. Features unified keyword search, revoked certificate counts, column sorting, pagination, CSV export, individual PEM download, and revocation actions.
In-Browser CSR Generation
Simultaneously generate private keys and CSRs with immediate ZIP package downloads. Issue and download signed PEM certificates from uploaded CSR files.
CRL / OCSP / SCEP / ACME Services
- Plain HTTP Listener (Port 8082): Serves Root CA certificates (
/ca.pem), SCEP CA certificates (/scepca.pem), CRL (/crl), OCSP (/ocsp), and SCEP (/scep) (preventing TLS bootstrap issues and circular dependencies). - ACME Listener (Port 8083): RFC 8555-compliant Automated Certificate Management Environment (Let’s Encrypt compatible).
- Real-time service status monitoring with status-aware background coloring and immediate runtime configuration updates.
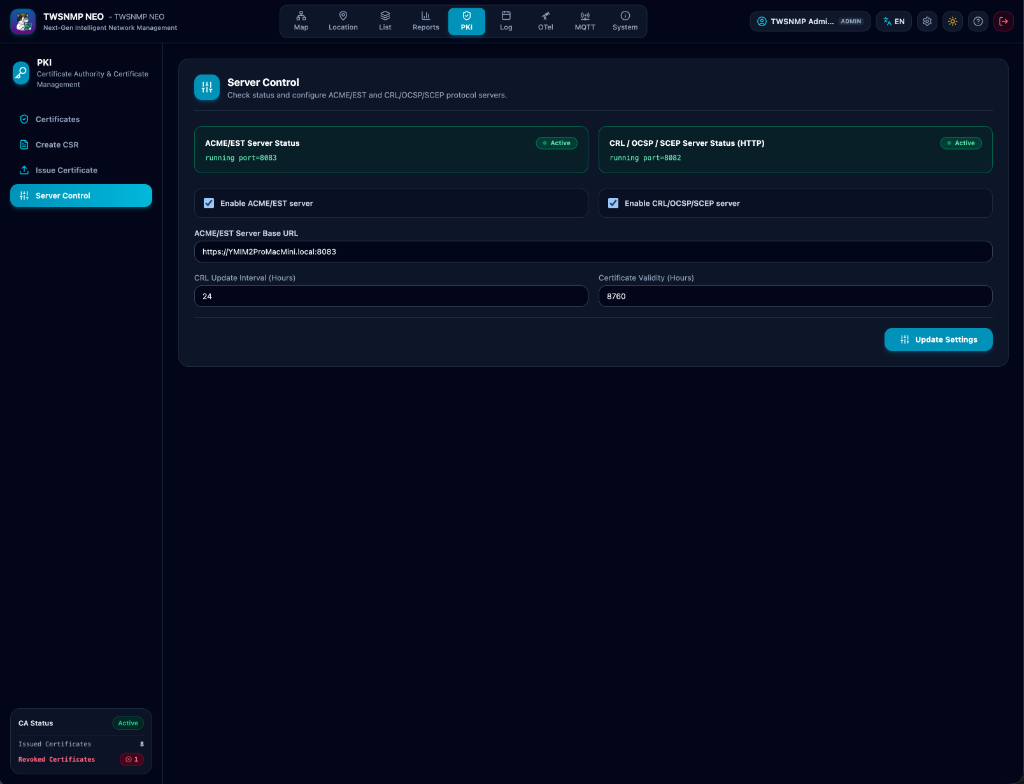
ACME Auto-Renewal Client & TLS Certificates
When operating TWSNMP NEO over HTTPS (TLS), the built-in ACME client (powered by lego) can automatically acquire and renew certificates from public ACME providers like Let’s Encrypt or the internal ACME server. It also supports manual PEM certificate/key file paths and seamless certificate migration from TWSNMP FC.
11. AI & MCP Integration
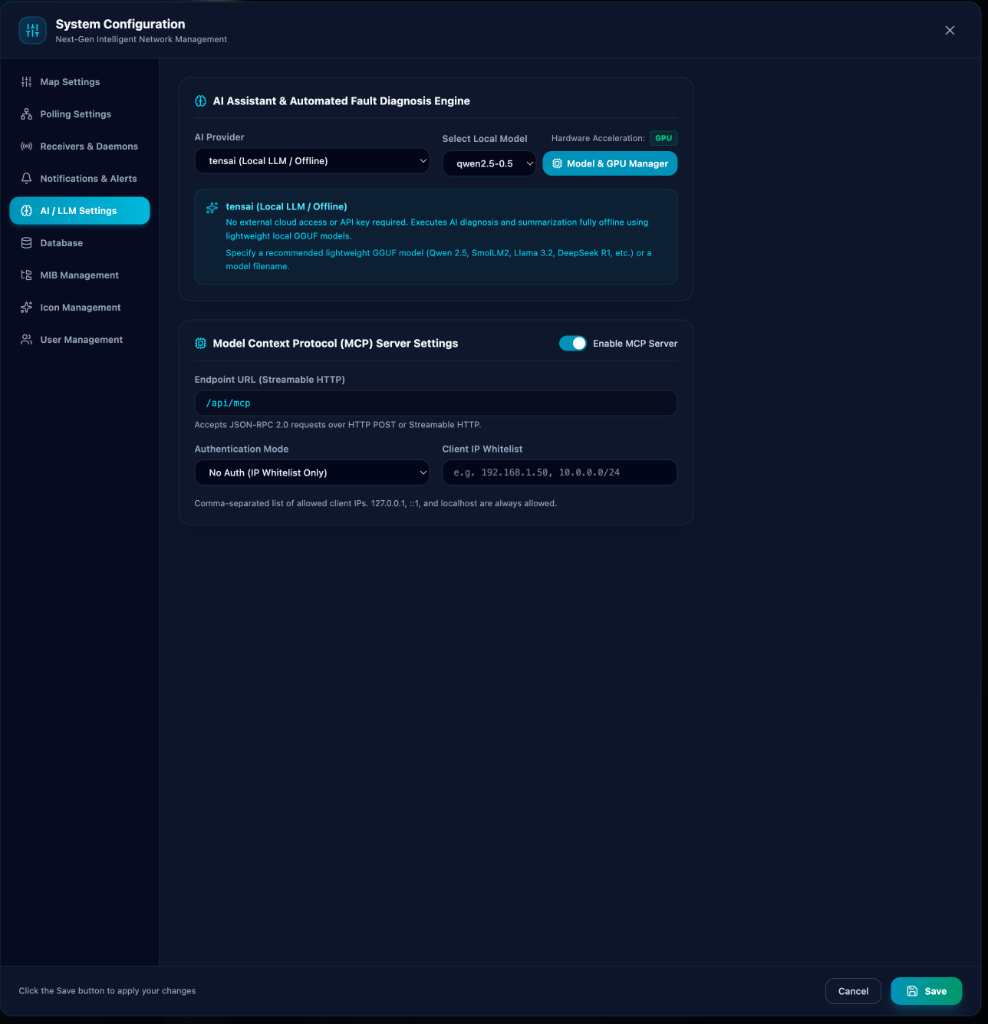
LLM Configuration (Local LLM / Cloud AI Services)
Configure AI providers (Local tensai LLM, Gemini, OpenAI, Claude, Ollama) and parameters directly from the settings.
Local LLM & WebGPU Acceleration
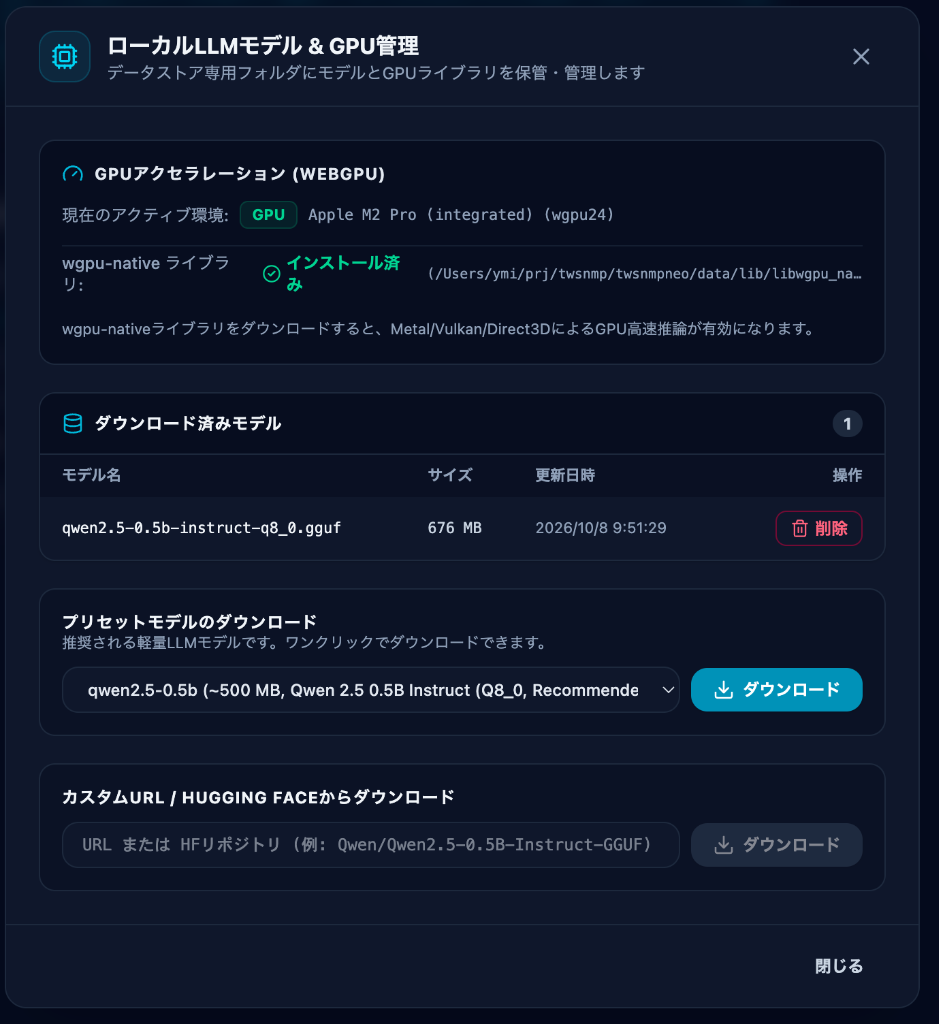
TWSNMP NEO includes an offline inference engine (tensai v0.0.35+) requiring zero external cloud dependencies or API keys. Supports one-click Hugging Face model downloads, expanded model presets, hardware-accelerated local WebGPU inference, rich Markdown output formatting, language switching, and smooth loading animations.
HTTP timeouts for local and external LLMs are extended to 15 minutes, with built-in output parsing for reasoning and thinking models (such as DeepSeek-R1 and Qwen) via Ollama.
Native Streamable HTTP MCP Server
TWSNMP NEO provides a built-in Model Context Protocol (MCP) server over Streamable HTTP (/api/mcp).
42 diagnostic and management tools (node/line/polling CRUD, immediate polling check, Ping/SNMP/MIB, NetFlow/Syslog/Trap/Event logs, AI anomaly scores, OTel APM metrics/traces, report summaries, sensor filters) and 31 prompt templates are exposed directly to AI agents like Cursor, Claude Desktop, and Antigravity to inspect network status, query logs, manage monitoring configurations, and execute diagnostic tools autonomously.
Refer to the MCP Specification & Guide and AI Prompts Guide for architecture details.
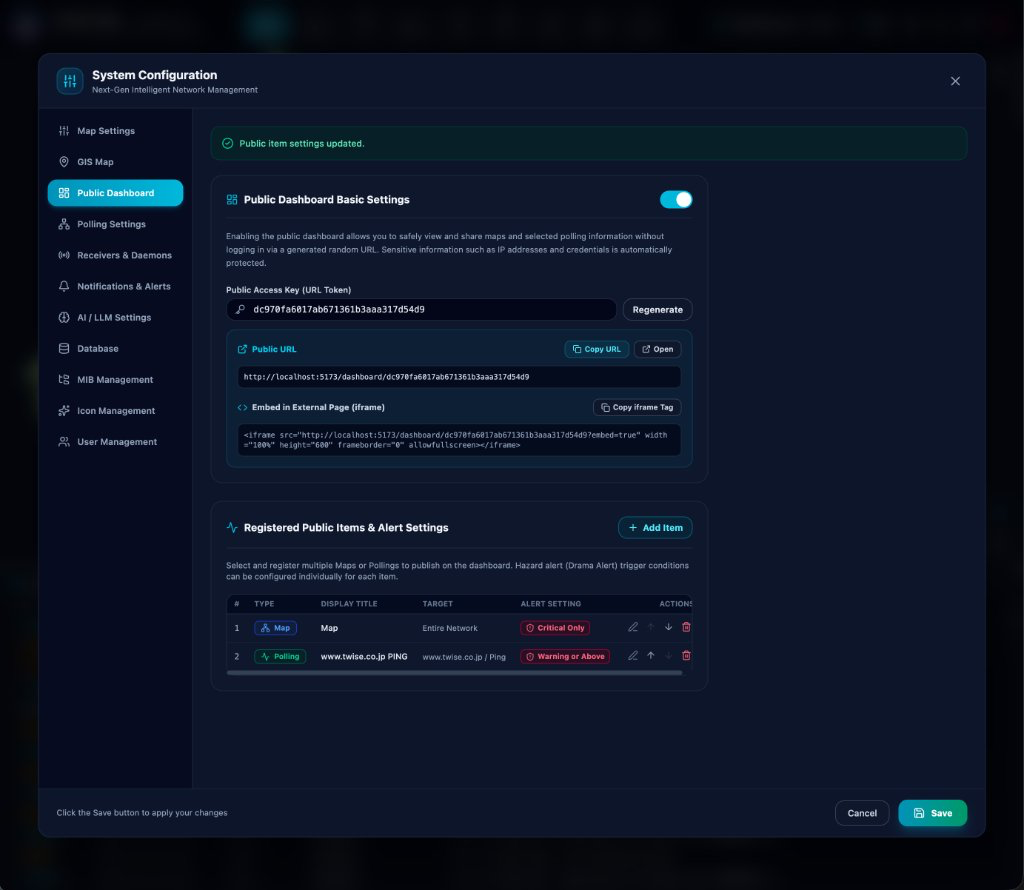
12. Public Dashboard & Embed System
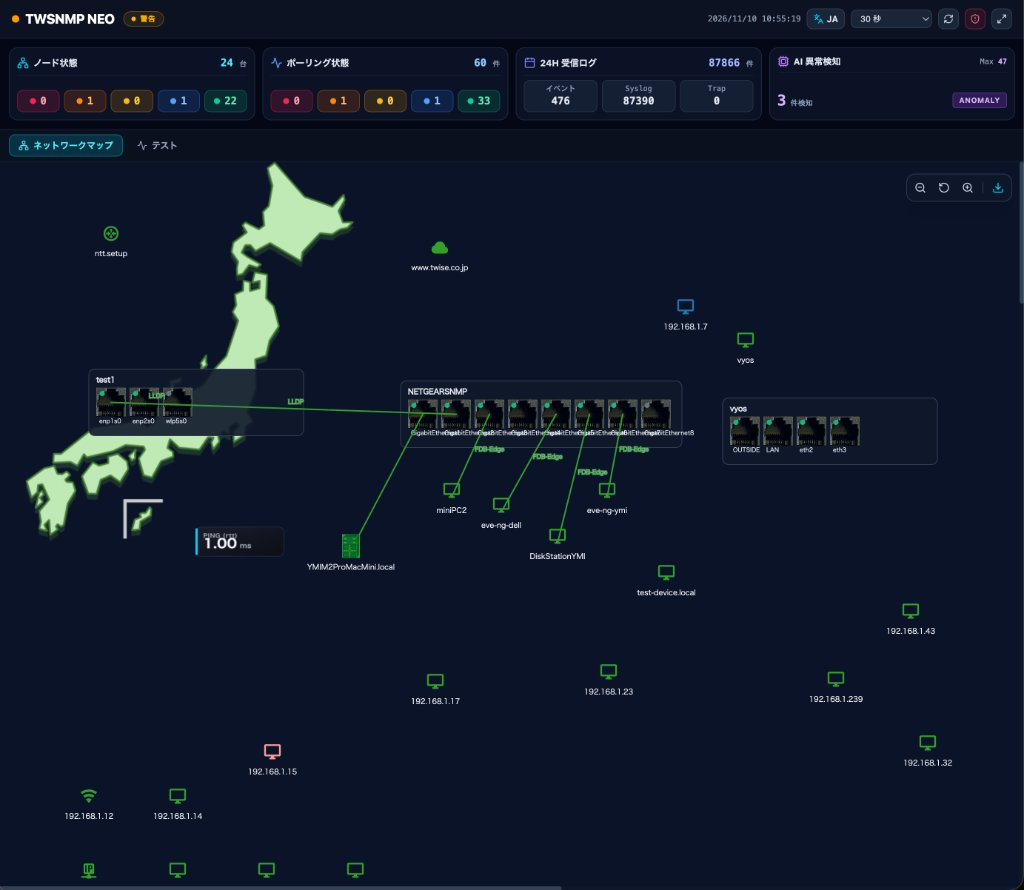
TWSNMP NEO features a secure, token-authenticated public dashboard designed for external sharing, NOC video walls, and team monitors without login credentials.
Key Features
- Secure Token-Based Public Access (
/dashboard/:key): Read-only public URL using a randomized secret key. Sensitive data (IP addresses, MAC addresses, credentials, LLM API keys) is automatically sanitized and masked before transmission. - Multiple Item Registration & Auto-Rotation: Register multiple views (complete topology map and specific critical node polling metrics like response times, bandwidth, or CPU load) and rotate through them automatically at custom intervals.
- twFathom-Style Summary KPI Cards: Arranges balanced 5-level severity breakdown pills (HIGH, LOW, WARN, REPAIR, NORMAL) in equal-width grids across the top banner. Delivers instant visibility across node states, polling states, 24-hour log ingestion volume (Event/Syslog/Trap), and AI anomaly scores.
- Bilingual Internationalization (i18n): Instant JA/EN locale toggle button in the header with persistent preferences, fully translating KPI labels, date formatting, chart tooltips, and alert overlay messages.
- Smooth Time-Series Charting: Features smooth gradient area and line charts powered by Apache ECharts for historical trending and instant spike detection.
- TV-Drama Style Emergency Alert Overlay (Drama Alert Overlay): Configure alert trigger conditions independently per item (Warning and above, or High Critical only). When triggered, an eye-catching full-screen hazard overlay displays top/bottom hazard stripes, a pulsing red background, exact incident details (node, poller, value, timestamp, count), and a DISMISS button.
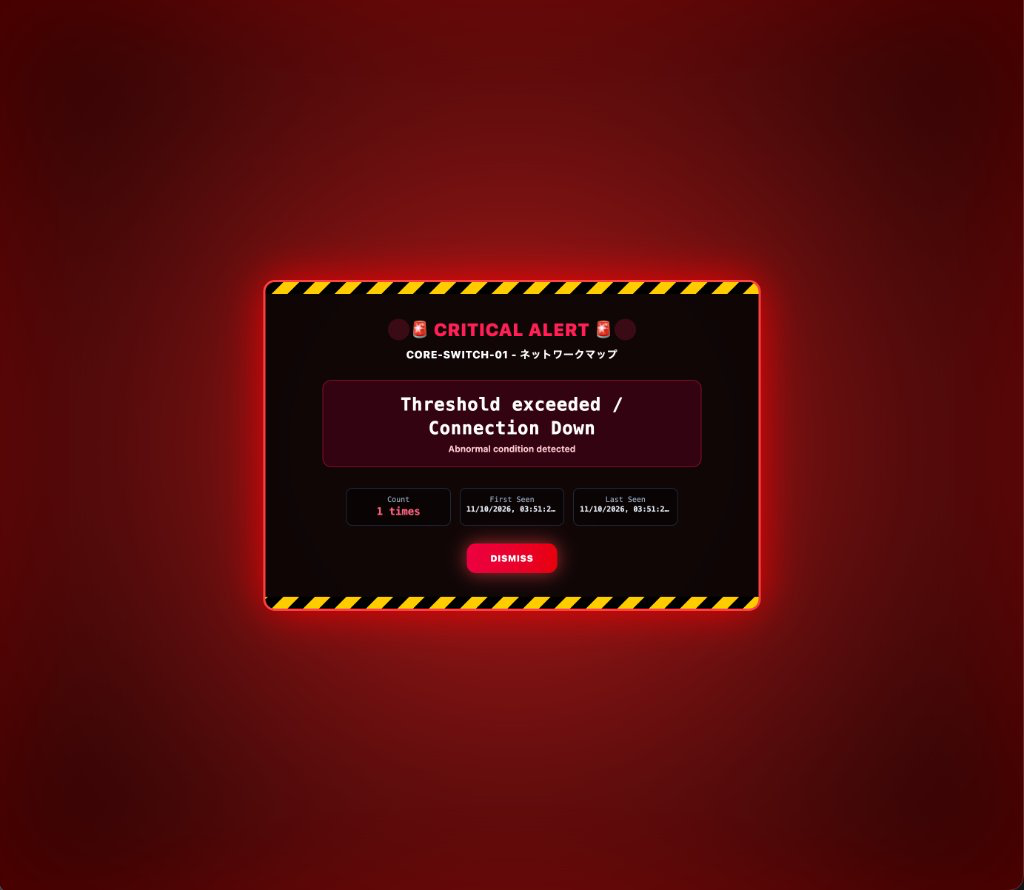
- Web Audio Audible Siren: Synthesizes an electronic beep siren directly via the browser’s Web Audio API (configurable per item with auto-silence timeout).
- External Embedding (iframe):
Supports embedding into internal portals and wikis with
Content-Security-Policy: frame-ancestors *. Use?embed=trueto enable compact mode with reduced header padding.
13. Settings & System Administration
System Status & Resource Monitor (Two-Tab Layout)
The system administration interface is organized into two dedicated tabs:
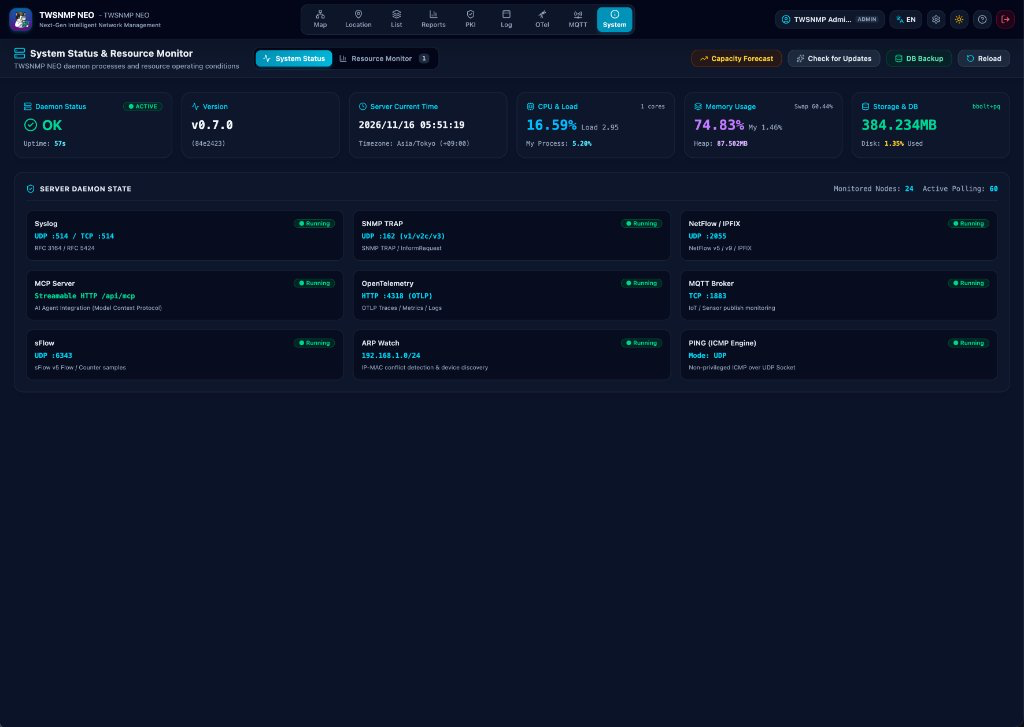
- “System Status” Tab:
- Daemon Health: Comprehensive overview of Syslog, TRAP, NetFlow, sFlow, ARP Watch, OpenTelemetry, MQTT, MCP server, and PKI/ACME daemons, including immediate bind error reporting (port conflicts or permission failures) on individual receiver cards and overall system status.
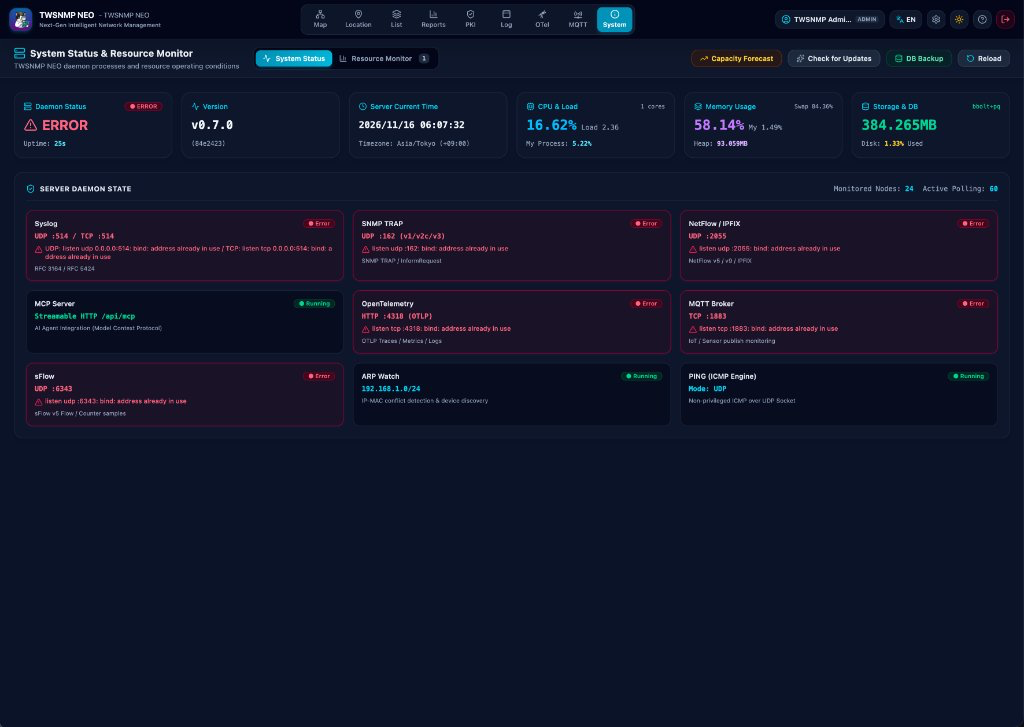
- System Info & Self-Update: Hardware specs (OS, CPU cores, architecture, uptime) and version information. Live update notification banners alert when new releases are available, enabling one-click in-place self-updates directly from the Web UI.
- Capacity Forecast & DB Backup: One-click database backups and storage growth predictions.
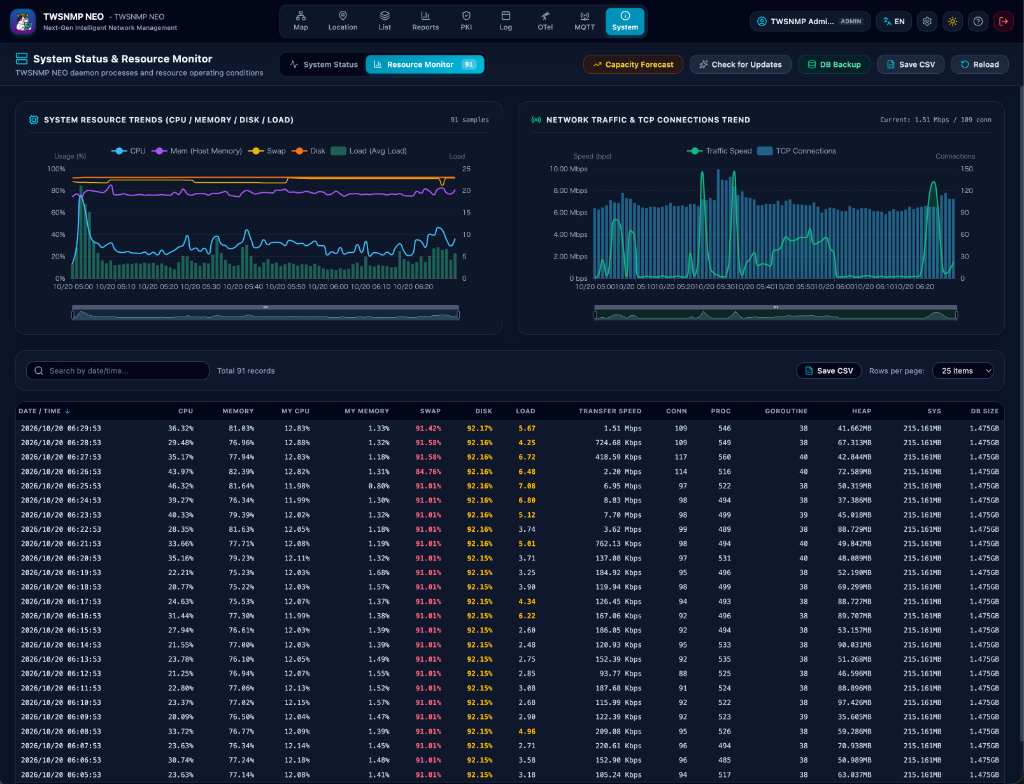
- “Resource Monitor” Tab:
- Real-time telemetry charts for CPU utilization, memory heap, active Goroutines, swap, and disk I/O metrics.
Public Dashboard Configuration
Configure the public dashboard via the “Dashboard” tab in System Configuration: enable/disable public access, regenerate keys, add and reorder public items (map and pollings), set custom titles and rotation intervals, configure Drama Alert trigger rules, and copy URLs or iframe embed snippets with a single click:
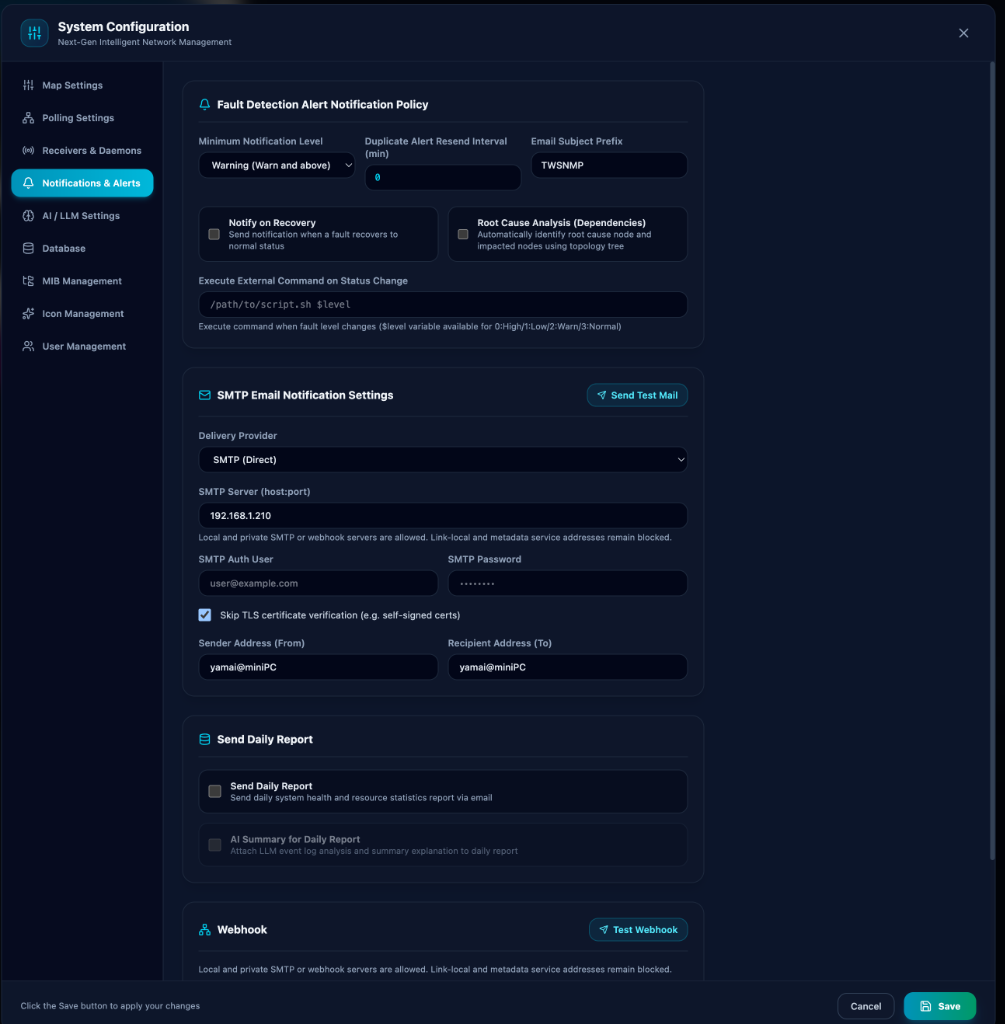
Notifications (Email / Webhook)
Receive instant alerts and periodic reports across supported channels:
- Email (SMTP / Google OAuth2 / Microsoft 365 OAuth2): Formatted HTML alert summaries (including direct access links back to TWSNMP NEO) and daily operational reports (including storage footprint analytics for both bbolt and Parquet, alongside grouped warning event summaries
count=N). - Webhooks: Real-time event notifications and daily report postings sent directly to your custom webhook endpoints or automation workflows (including storage metrics and grouped warning events).
- External Command Execution: Execute arbitrary OS scripts or commands triggered on fault level state changes.
Database Settings & Scheduled Backups
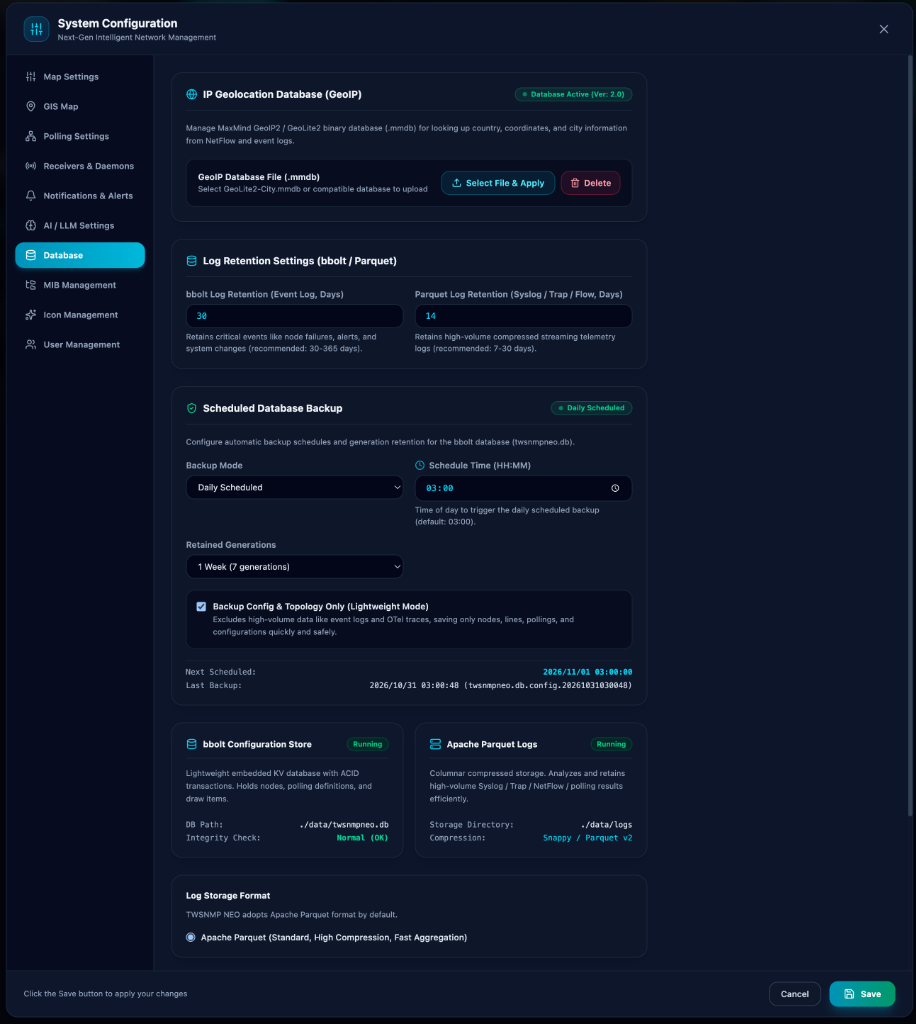
- Independent Log Retention:
- Event Log Retention (bbolt, Days): Historical retention for system and polling state change alerts (default: 30 days).
- Streaming Log Retention (Parquet, Days): Retention duration for large streaming logs such as Syslog, SNMP TRAP, and Flow records (default: 14 days).
- Max Parquet Storage (GB): Configurable disk storage cap for Parquet columnar logs.
- Automated Database Backups:
- Schedule Mode: Choose from Disabled, Daily (
daily), Once (once), or Run Once & Daily (once_daily). - Execution Time: Configurable scheduled runtime (HH:MM format, e.g.
03:00). - Retained Generations: Automatically rotates and keeps between 1 and 30 generations.
- Config-Only Mode (
ConfigOnly): Saves a lightweight, instant snapshot containing map topology, nodes, lines, and polling definitions while omitting voluminous event logs and OTel traces.
- Schedule Mode: Choose from Disabled, Daily (
- Topology Export & Reset: Export map data and polling configurations as JSON / ZIP archives or reset the database.
Backup Management & Disaster Recovery
Open the dedicated Backup Manager modal directly from the System Status tab to inspect and manage all database archives.
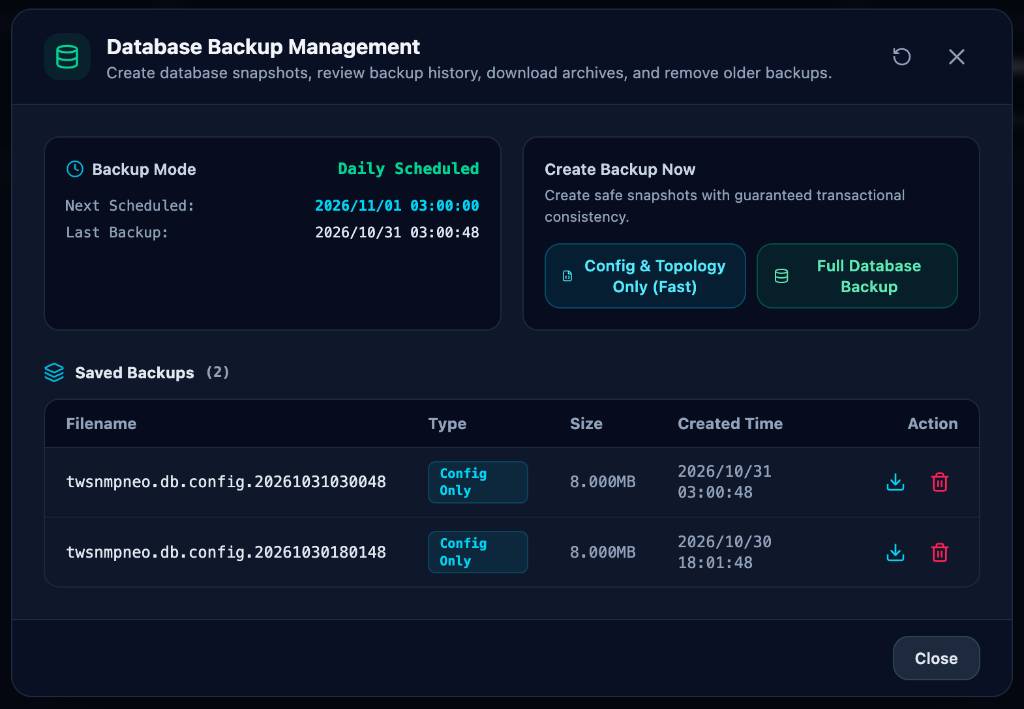
- Web UI Management:
- Inspect backup archives with file names, sizes, and creation timestamps.
- Trigger on-demand backups instantly (“Full Backup” or “Config-Only Backup”).
- Download backup archives directly in the browser and remove old backups.
- Offline CLI Disaster Recovery & Maintenance:
- Offline Restoration (
-restore): Restores the database from a backup file with automatic pre-restore safety archiving of the active DB.twsnmpneo -datastore ./data -restore ./backups/twsnmpneo_backup_20261031_030000.db - Database Compaction (
-compact): Reclaims unused database space and resolves bbolt fragmentation.twsnmpneo -datastore ./data -compact ./data/twsnmpneo_compacted.db
- Offline Restoration (
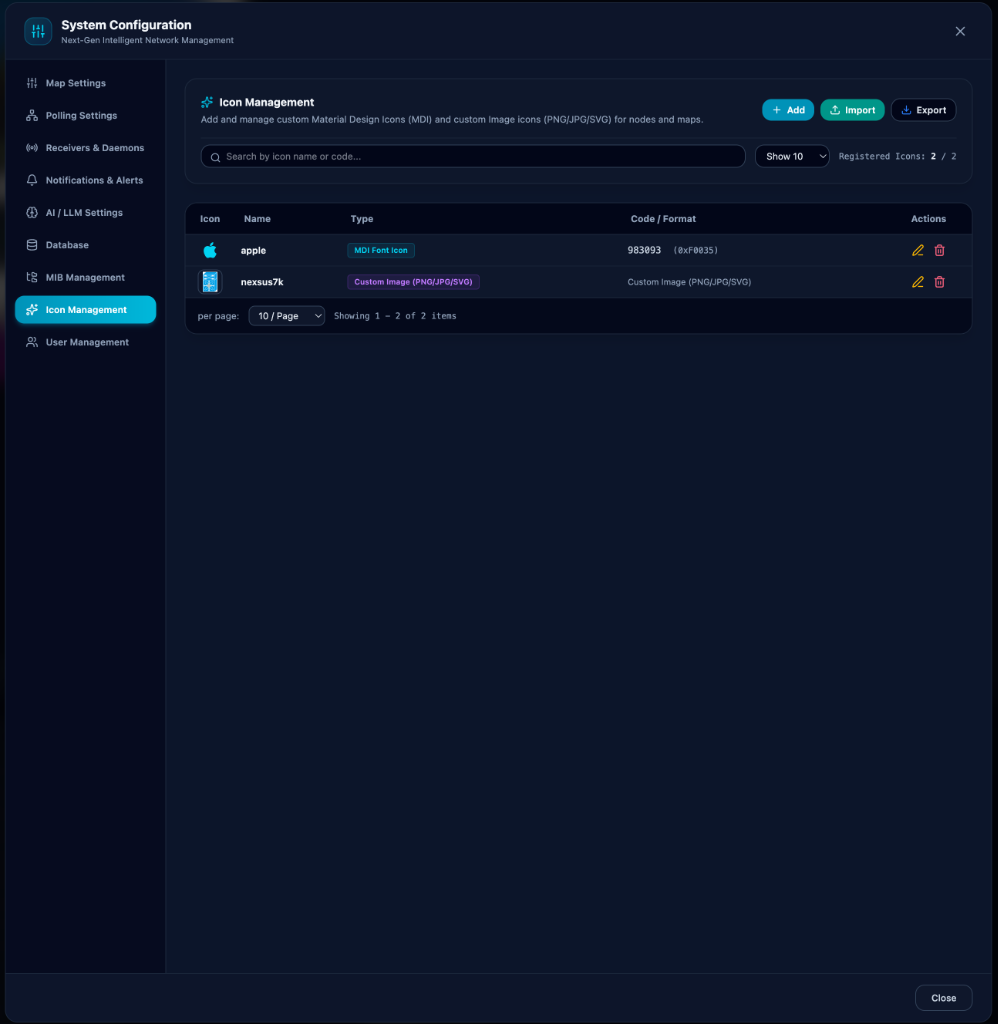
Icon Management & Custom Assets
Manage built-in Material Design Icons (MDI) and import/export custom PNG/JPEG/SVG image icons for map nodes and topology elements.
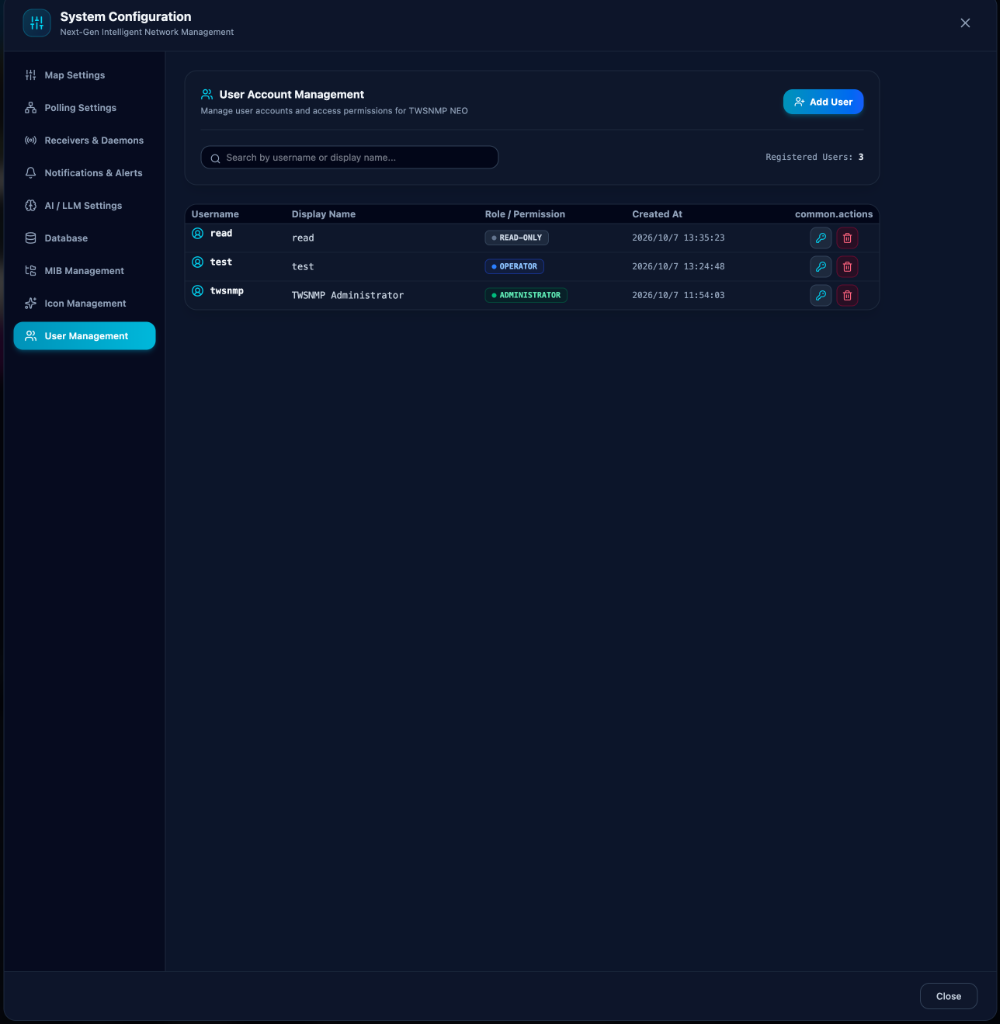
User Account Management & Access Control
Manage multi-user access with granular role-based permissions (ADMINISTRATOR, OPERATOR, READ-ONLY) and secure credential management.
URL Parameter Auto-Login & History Sanitization (twsnmpmw Integration)
Seamlessly integrates with multi-window managers and centralized monitoring portals like twsnmpmw:
- Supported Parameters:
- Token Login:
?token=<JWT_TOKEN> - Credentials:
?user=<username>&password=<password>(orUserID,Password) - Target View:
?view=map(location,list,logs,otel,mqtt,reports,system,pki)
- Token Login:
- Automatic History Sanitization: Following authentication, all credential query parameters are instantly sanitized and erased from the browser address bar (
cleanAuthParams) usingwindow.history.replaceState, eliminating security risks when copying or sharing dashboard URLs.
Conclusion
TWSNMP NEO delivers a robust, container-native network observability platform with 3D visualization, big data log storage, and native AI integration. Start managing your network today using Docker or standalone binaries!